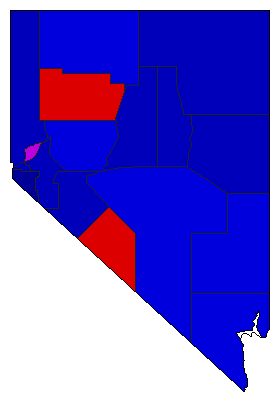
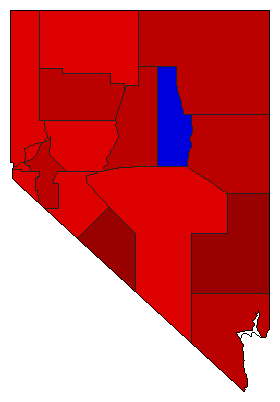
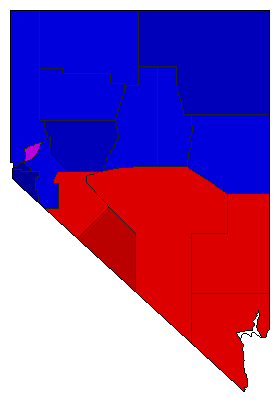
1930 General Election Results Comparison - Nevada
| Map | Pie | Office | Total | D | R | I | Margin | %Margin | Dem | Rep | Ind | Oth. | Dem | Rep | Ind | Other |
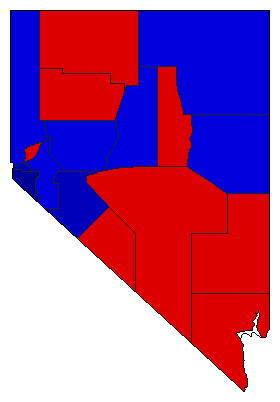 | Governor | 34,634 | 2 | 1 | 0 | 2,250 | 6.50% | 46.75% | 53.25% | 0.00% | 0.00% | 16,192 | 18,442 | 0 | 0 | |
 | Lt. Governor | 33,436 | 2 | 1 | 0 | 6,316 | 18.89% | 40.56% | 59.44% | 0.00% | 0.00% | 13,560 | 19,876 | 0 | 0 | |
 | Secretary of State | 33,396 | 1 | 2 | 0 | 6,758 | 20.24% | 60.12% | 39.88% | 0.00% | 0.00% | 20,077 | 13,319 | 0 | 0 | |
 | State Treasurer | 33,410 | 2 | 1 | 0 | 3,812 | 11.41% | 44.30% | 55.70% | 0.00% | 0.00% | 14,799 | 18,611 | 0 | 0 | |
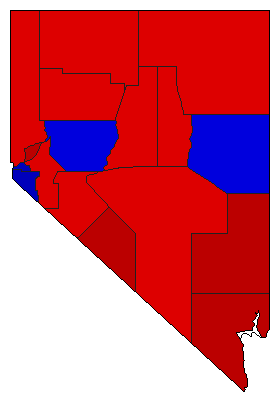 | Attorney General | 33,346 | 1 | 2 | 0 | 3,870 | 11.61% | 55.80% | 44.20% | 0.00% | 0.00% | 18,608 | 14,738 | 0 | 0 | |
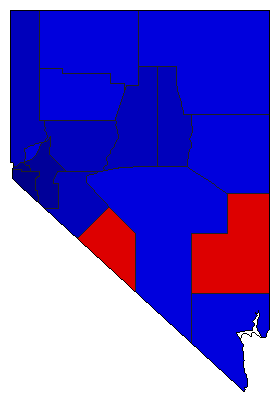 | Controller | 32,525 | 2 | 1 | 0 | 7,235 | 22.24% | 38.88% | 61.12% | 0.00% | 0.00% | 12,645 | 19,880 | 0 | 0 |
Nevada Results for 1930
Login
© Dave Leip's Atlas of U.S. Elections, LLC 2019 All Rights Reserved
Note: The advertisement links below may advocate political positions that this site does not endorse.
Login
© Dave Leip's Atlas of U.S. Elections, LLC 2019 All Rights Reserved
Note: The advertisement links below may advocate political positions that this site does not endorse.