1970 General Election Results Comparison - New York
| Map | Pie | Office | Total | D | R | I | Margin | %Margin | Dem | Rep | Ind | Oth. | Dem | Rep | Ind | Other |
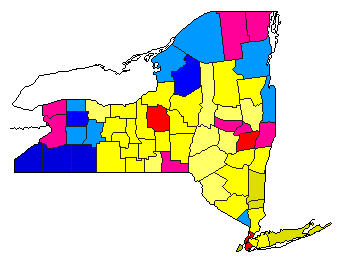 | Senator | 5,863,894 | 2 | 3 | 0 | 116,958 | 1.99% | 37.03% | 23.95% | 0.00% | 39.02% | 2,171,232 | 1,404,472 | 0 | 2,288,190 | |
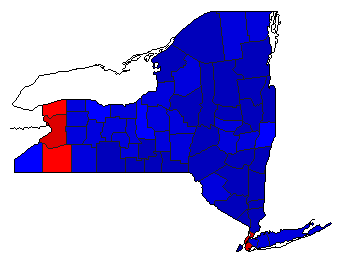 | Governor | 5,963,462 | 2 | 1 | 0 | 714,589 | 11.98% | 40.47% | 52.46% | 0.00% | 7.07% | 2,413,672 | 3,128,261 | 0 | 421,529 |
New York Results for 1970
Login
© Dave Leip's Atlas of U.S. Elections, LLC 2019 All Rights Reserved
Note: The advertisement links below may advocate political positions that this site does not endorse.
Login
© Dave Leip's Atlas of U.S. Elections, LLC 2019 All Rights Reserved
Note: The advertisement links below may advocate political positions that this site does not endorse.