1954 General Election Results Comparison - Arizona
| Map | Pie | Office | Total | D | R | I | Margin | %Margin | Dem | Rep | Ind | Oth. | Dem | Rep | Ind | Other |
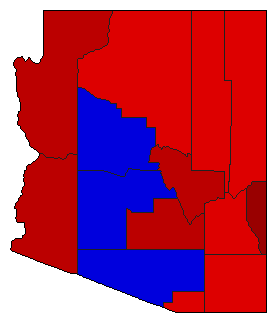 |  | Governor | 243,970 | 1 | 2 | 0 | 12,238 | 5.02% | 52.51% | 47.49% | 0.00% | 0.00% | 128,104 | 115,866 | 0 | 0 |
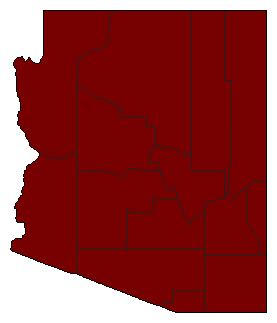 |  | Secretary of State | 161,905 | 1 | 0 | 0 | 161,905 | 100.00% | 100.00% | 0.00% | 0.00% | 0.00% | 161,905 | 0 | 0 | 0 |
 |  | State Treasurer | 161,425 | 1 | 0 | 0 | 161,425 | 100.00% | 100.00% | 0.00% | 0.00% | 0.00% | 161,425 | 0 | 0 | 0 |
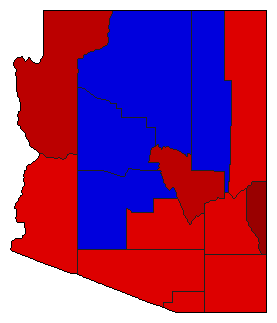 |  | Attorney General | 231,977 | 1 | 2 | 0 | 6,775 | 2.92% | 51.46% | 48.54% | 0.00% | 0.00% | 119,376 | 112,601 | 0 | 0 |
 |  | State Auditor | 169,618 | 1 | 0 | 0 | 169,618 | 100.00% | 100.00% | 0.00% | 0.00% | 0.00% | 169,618 | 0 | 0 | 0 |
Arizona Results for 1954
Login
© Dave Leip's Atlas of U.S. Elections, LLC 2019 All Rights Reserved
Note: The advertisement links below may advocate political positions that this site does not endorse.
Login
© Dave Leip's Atlas of U.S. Elections, LLC 2019 All Rights Reserved
Note: The advertisement links below may advocate political positions that this site does not endorse.