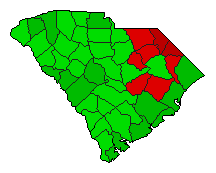
2004 General Election Results Comparison - South Carolina
| Map | Pie | Office | Total | D | R | I | Margin | %Margin | Dem | Rep | Ind | Oth. | Dem | Rep | Ind | Other |
 |  | President | 1,617,730 | 2 | 1 | - | 276,275 | 17.08% | 40.90% | 57.98% | 0.00% | 1.12% | 661,699 | 937,974 | 0 | 18,057 |
 |  | Senator | 1,597,221 | 2 | 1 | 0 | 152,783 | 9.57% | 44.10% | 53.67% | 0.00% | 2.23% | 704,384 | 857,167 | 0 | 35,670 |
| Map | Pie | Initiative | Total Vote | N | Y | Margin | %Margin | No | Yes | Oth. | No | Yes | ||||
 | Initiative | 1,406,472 | 2 | 0 | 1 | 258,942 | 18.41% | 40.79% | 0.00% | 59.21% | 0.00% | 573,765 | 0 | 832,707 | 0 | |
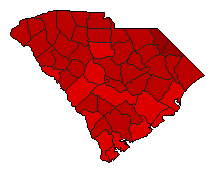 | Initiative | 1,353,723 | 1 | 0 | 2 | 297,481 | 21.98% | 60.99% | 0.00% | 39.01% | 0.00% | 825,602 | 0 | 528,121 | 0 | |
South Carolina Results for 2004
Login
© Dave Leip's Atlas of U.S. Elections, LLC 2019 All Rights Reserved
Note: The advertisement links below may advocate political positions that this site does not endorse.
Login
© Dave Leip's Atlas of U.S. Elections, LLC 2019 All Rights Reserved
Note: The advertisement links below may advocate political positions that this site does not endorse.