1950 General Election Results Comparison - Washington
| Map | Pie | Office | Total | D | R | I | Margin | %Margin | Dem | Rep | Ind | Oth. | Dem | Rep | Ind | Other |
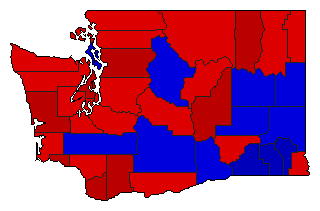 | Senator | 744,783 | 1 | 2 | 0 | 55,255 | 7.42% | 53.40% | 45.98% | 0.00% | 0.62% | 397,719 | 342,464 | 0 | 4,600 | |
| Map | Pie | Initiative | Total Vote | N | Y | Margin | %Margin | No | Yes | Oth. | No | Yes | ||||
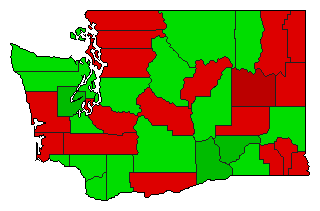 | Initiative | 582,862 | 2 | 0 | 1 | 2,852 | 0.49% | 49.76% | 0.00% | 50.24% | 0.00% | 290,005 | 0 | 292,857 | 0 | |
Washington Results for 1950
Login
© Dave Leip's Atlas of U.S. Elections, LLC 2019 All Rights Reserved
Note: The advertisement links below may advocate political positions that this site does not endorse.
Login
© Dave Leip's Atlas of U.S. Elections, LLC 2019 All Rights Reserved
Note: The advertisement links below may advocate political positions that this site does not endorse.