1956 General Election Results Comparison - Wisconsin
| Map | Pie | Office | Total | D | R | I | Margin | %Margin | Dem | Rep | Ind | Oth. | Dem | Rep | Ind | Other |
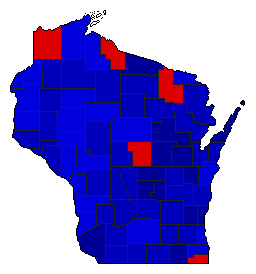
 |  | President | 1,550,558 | 2 | 1 | 0 | 368,076 | 23.74% | 37.84% | 61.58% | 0.00% | 0.58% | 586,768 | 954,844 | 0 | 8,946 |
 | Senator | 1,523,121 | 2 | 1 | 3 | 264,570 | 17.37% | 41.22% | 58.60% | 0.18% | 0.00% | 627,903 | 892,473 | 2,745 | 0 | |
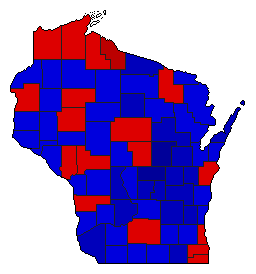 | Governor | 1,557,788 | 2 | 1 | 0 | 58,852 | 3.78% | 48.11% | 51.89% | 0.00% | 0.01% | 749,421 | 808,273 | 0 | 94 | |
 |  | Lt. Governor | 1,507,667 | 2 | 1 | 0 | 137,936 | 9.15% | 45.42% | 54.57% | 0.00% | 0.00% | 684,844 | 822,780 | 0 | 43 |
 |  | Secretary of State | 1,519,681 | 2 | 1 | 0 | 257,855 | 16.97% | 41.51% | 58.48% | 0.00% | 0.01% | 630,851 | 888,706 | 0 | 124 |
 |  | State Treasurer | 1,496,734 | 2 | 1 | 0 | 224,504 | 15.00% | 42.50% | 57.50% | 0.00% | 0.01% | 636,074 | 860,578 | 0 | 82 |
 |  | Attorney General | 1,482,912 | 2 | 1 | 3 | 175,492 | 11.83% | 42.47% | 54.31% | 3.21% | 0.00% | 629,861 | 805,353 | 47,643 | 55 |
Wisconsin Results for 1956
Login
© Dave Leip's Atlas of U.S. Elections, LLC 2019 All Rights Reserved
Note: The advertisement links below may advocate political positions that this site does not endorse.
Login
© Dave Leip's Atlas of U.S. Elections, LLC 2019 All Rights Reserved
Note: The advertisement links below may advocate political positions that this site does not endorse.