1938 General Election Results Comparison - Wisconsin
| Map | Pie | Office | Total | D | R | I | Margin | %Margin | Dem | Rep | Ind | Oth. | Dem | Rep | Ind | Other |
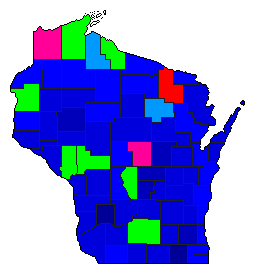 | Senator | 937,503 | 3 | 1 | 2 | 197,561 | 21.07% | 24.74% | 47.66% | 26.58% | 1.02% | 231,976 | 446,770 | 249,209 | 9,548 | |
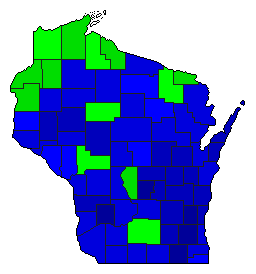 | Governor | 981,525 | 3 | 1 | 2 | 190,294 | 19.39% | 7.99% | 55.39% | 36.00% | 0.61% | 78,446 | 543,675 | 353,381 | 6,023 | |
 |  | Lt. Governor | 911,053 | 3 | 1 | 2 | 164,018 | 18.00% | 12.41% | 52.37% | 34.36% | 0.86% | 113,057 | 477,084 | 313,066 | 7,846 |
 |  | Secretary of State | 939,986 | 3 | 1 | 2 | 29,894 | 3.18% | 12.79% | 44.79% | 41.61% | 0.81% | 120,221 | 421,044 | 391,150 | 7,571 |
 |  | State Treasurer | 915,279 | 3 | 1 | 2 | 58,617 | 6.40% | 12.20% | 46.69% | 40.28% | 0.83% | 111,645 | 427,324 | 368,707 | 7,603 |
 |  | Attorney General | 898,556 | 3 | 1 | 2 | 115,021 | 12.80% | 16.52% | 48.04% | 35.24% | 0.20% | 148,426 | 431,678 | 316,657 | 1,795 |
Wisconsin Results for 1938
Login
© Dave Leip's Atlas of U.S. Elections, LLC 2019 All Rights Reserved
Note: The advertisement links below may advocate political positions that this site does not endorse.
Login
© Dave Leip's Atlas of U.S. Elections, LLC 2019 All Rights Reserved
Note: The advertisement links below may advocate political positions that this site does not endorse.