1970 General Election Results Comparison - Colorado
| Map | Pie | Office | Total | D | R | I | Margin | %Margin | Dem | Rep | Ind | Oth. | Dem | Rep | Ind | Other |
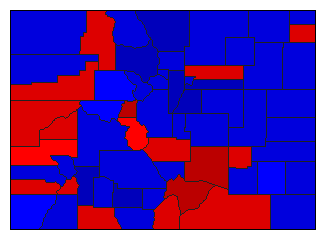 |  | Governor | 668,495 | 2 | 1 | 0 | 48,258 | 7.22% | 45.24% | 52.46% | 0.00% | 2.30% | 302,432 | 350,690 | 0 | 15,373 |
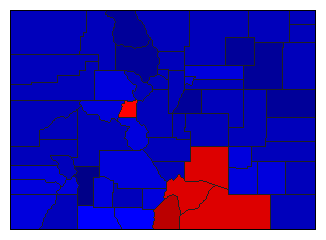 |  | Secretary of State | 630,021 | 2 | 1 | 0 | 125,459 | 19.91% | 38.74% | 58.65% | 0.00% | 2.61% | 244,052 | 369,511 | 0 | 16,458 |
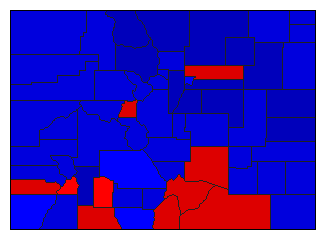 |  | State Treasurer | 623,757 | 2 | 1 | 0 | 74,505 | 11.94% | 41.54% | 53.49% | 0.00% | 4.97% | 259,132 | 333,637 | 0 | 30,988 |
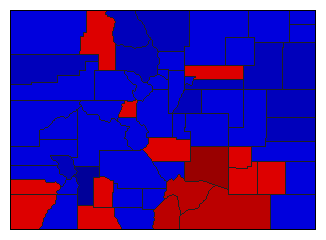 |  | Attorney General | 625,403 | 2 | 1 | 0 | 20,153 | 3.22% | 48.39% | 51.61% | 0.00% | 0.00% | 302,625 | 322,778 | 0 | 0 |
Colorado Results for 1970
Login
© Dave Leip's Atlas of U.S. Elections, LLC 2019 All Rights Reserved
Note: The advertisement links below may advocate political positions that this site does not endorse.
Login
© Dave Leip's Atlas of U.S. Elections, LLC 2019 All Rights Reserved
Note: The advertisement links below may advocate political positions that this site does not endorse.