1844 General Election Results Comparison - Ohio
| Map | Pie | Office | Total | D | R | I | Margin | %Margin | Dem | Rep | Ind | Oth. | Dem | Rep | Ind | Other |
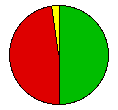 | President | 312,224 | 2 | 0 | 1 | 6,052 | 1.94% | 47.74% | 0.00% | 49.68% | 2.58% | 149,061 | 0 | 155,113 | 8,050 |
Ohio Results for 1844
Login
© Dave Leip's Atlas of U.S. Elections, LLC 2019 All Rights Reserved
Note: The advertisement links below may advocate political positions that this site does not endorse.
Login
© Dave Leip's Atlas of U.S. Elections, LLC 2019 All Rights Reserved
Note: The advertisement links below may advocate political positions that this site does not endorse.