1852 General Election Results Comparison - Ohio
| Map | Pie | Office | Total | D | R | I | Margin | %Margin | Dem | Rep | Ind | Oth. | Dem | Rep | Ind | Other |
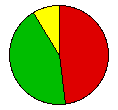 | President | 353,188 | 1 | 0 | 2 | 16,410 | 4.65% | 47.83% | 0.00% | 43.18% | 8.98% | 168,933 | 0 | 152,523 | 31,732 |
Ohio Results for 1852
Login
© Dave Leip's Atlas of U.S. Elections, LLC 2019 All Rights Reserved
Note: The advertisement links below may advocate political positions that this site does not endorse.
Login
© Dave Leip's Atlas of U.S. Elections, LLC 2019 All Rights Reserved
Note: The advertisement links below may advocate political positions that this site does not endorse.