1880 General Election Results Comparison - New Hampshire
| Map | Pie | Office | Total | D | R | I | Margin | %Margin | Dem | Rep | Ind | Oth. | Dem | Rep | Ind | Other |
 | 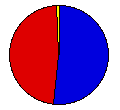 | President | 86,361 | 2 | 1 | - | 4,059 | 4.70% | 47.24% | 51.94% | 0.00% | 0.82% | 40,797 | 44,856 | 0 | 708 |
New Hampshire Results for 1880
Login
© Dave Leip's Atlas of U.S. Elections, LLC 2019 All Rights Reserved
Note: The advertisement links below may advocate political positions that this site does not endorse.
Login
© Dave Leip's Atlas of U.S. Elections, LLC 2019 All Rights Reserved
Note: The advertisement links below may advocate political positions that this site does not endorse.