| Map | Pie | Office | Total | D | R | I | Margin | %Margin | Dem | Rep | Ind | Oth. | Dem | Rep | Ind | Other | | | | | | | | | | | | | | | | | | |
|---|
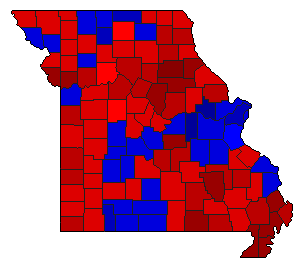
 |  | President |
673,906 |
1 |
2 |
- |
58,727 |
8.71% |
53.96% |
45.25% |
0.00% |
0.79% |
363,667 |
304,940 |
0 |
5,299 |
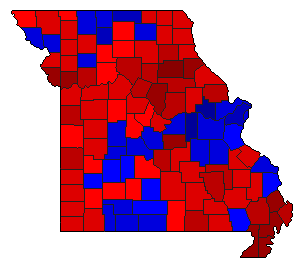
 |  | Governor |
663,967 |
1 |
2 |
3 |
43,334 |
6.53% |
52.87% |
46.35% |
0.39% |
0.39% |
351,063 |
307,729 |
2,588 |
2,587 |
 |  | Lt. Governor |
674,356 |
1 |
2 |
3 |
36,350 |
5.39% |
50.56% |
45.17% |
3.53% |
0.73% |
340,974 |
304,624 |
23,824 |
4,934 |
 |  | Secretary of State |
674,307 |
1 |
2 |
3 |
37,497 |
5.56% |
50.65% |
45.09% |
3.55% |
0.72% |
341,512 |
304,015 |
23,931 |
4,849 |
 |  | State Treasurer |
674,224 |
1 |
2 |
3 |
36,660 |
5.44% |
50.58% |
45.14% |
3.55% |
0.73% |
341,003 |
304,343 |
23,941 |
4,937 |
 |  | Attorney General |
673,399 |
1 |
2 |
3 |
35,899 |
5.33% |
50.58% |
45.25% |
3.57% |
0.60% |
340,585 |
304,686 |
24,063 |
4,065 |
 |  | State Auditor |
673,945 |
1 |
2 |
3 |
36,220 |
5.37% |
50.57% |
45.19% |
3.52% |
0.72% |
340,803 |
304,583 |
23,707 |
4,852 |
|
