1896 General Election Results Comparison - Washington
| Map | Pie | Office | Total | D | R | I | Margin | %Margin | Dem | Rep | Ind | Oth. | Dem | Rep | Ind | Other |
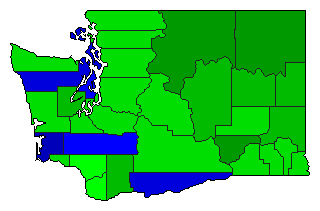
 |  | President | 93,583 | 1 | 2 | - | 14,161 | 15.13% | 56.97% | 41.84% | 0.00% | 1.19% | 53,314 | 39,153 | 0 | 1,116 |
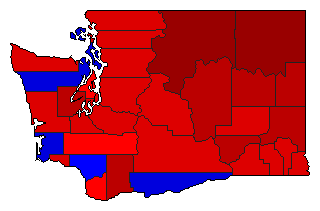 | Governor | 91,545 | 1 | 2 | 0 | 12,695 | 13.87% | 55.55% | 41.68% | 0.00% | 2.78% | 50,849 | 38,154 | 0 | 2,542 | |
 |  | Lt. Governor | 90,894 | 0 | 2 | 1 | 11,482 | 12.63% | 0.00% | 42.78% | 55.41% | 1.81% | 0 | 38,883 | 50,365 | 1,646 |
 |  | Secretary of State | 91,081 | 0 | 2 | 1 | 11,306 | 12.41% | 0.00% | 43.06% | 55.47% | 1.47% | 0 | 39,216 | 50,522 | 1,343 |
 |  | State Treasurer | 91,094 | 0 | 1 | 2 | 11,200 | 12.29% | 0.00% | 55.43% | 43.13% | 1.44% | 0 | 50,493 | 39,293 | 1,308 |
 |  | Attorney General | 91,266 | 0 | 2 | 1 | 11,300 | 12.38% | 0.00% | 42.91% | 55.29% | 1.80% | 0 | 39,162 | 50,462 | 1,642 |
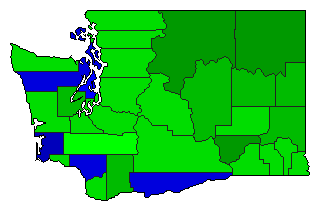 |  | Comptroller General | 90,987 | 0 | 2 | 1 | 11,588 | 12.74% | 0.00% | 42.95% | 55.68% | 1.37% | 0 | 39,077 | 50,665 | 1,245 |
 |  | State Auditor | 91,023 | 0 | 1 | 2 | 11,425 | 12.55% | 0.00% | 55.61% | 43.06% | 1.33% | 0 | 50,618 | 39,193 | 1,212 |
Washington Results for 1896
Login
© Dave Leip's Atlas of U.S. Elections, LLC 2019 All Rights Reserved
Note: The advertisement links below may advocate political positions that this site does not endorse.
Login
© Dave Leip's Atlas of U.S. Elections, LLC 2019 All Rights Reserved
Note: The advertisement links below may advocate political positions that this site does not endorse.