| Map | Pie | Office | Total | D | R | I | Margin | %Margin | Dem | Rep | Ind | Oth. | Dem | Rep | Ind | Other | | | | | | | | | | | | | | | | | | |
|---|
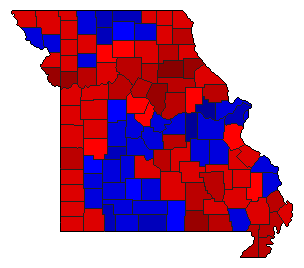
 |  | President |
683,656 |
1 |
2 |
- |
37,830 |
5.53% |
51.48% |
45.94% |
0.00% |
2.58% |
351,922 |
314,092 |
0 |
17,642 |
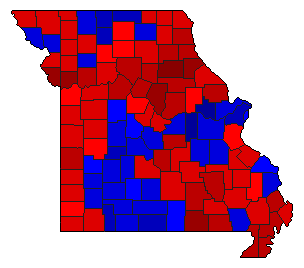
 |  | Governor |
684,294 |
1 |
2 |
5 |
32,140 |
4.70% |
51.15% |
46.46% |
0.64% |
1.75% |
350,045 |
317,905 |
4,356 |
11,988 |
 |  | Lt. Governor |
684,146 |
1 |
2 |
5 |
38,153 |
5.58% |
51.52% |
45.95% |
0.62% |
1.90% |
352,505 |
314,352 |
4,261 |
13,028 |
 |  | Secretary of State |
683,878 |
1 |
2 |
5 |
38,875 |
5.68% |
51.58% |
45.90% |
0.62% |
1.90% |
352,747 |
313,872 |
4,263 |
12,996 |
 |  | State Treasurer |
683,898 |
1 |
2 |
5 |
38,708 |
5.66% |
51.57% |
45.91% |
0.62% |
1.90% |
352,660 |
313,952 |
4,264 |
13,022 |
 |  | Attorney General |
682,640 |
1 |
2 |
5 |
38,452 |
5.63% |
51.64% |
46.01% |
0.63% |
1.72% |
352,517 |
314,065 |
4,296 |
11,762 |
 |  | State Auditor |
684,038 |
1 |
2 |
5 |
38,992 |
5.70% |
51.58% |
45.88% |
0.64% |
1.90% |
352,823 |
313,831 |
4,385 |
12,999 |
|
