| Map | Pie | Year | Total | D | R | I | Margin | %Margin | Dem | Rep | Ind | Oth. | Dem | Rep | Ind | Other | | | | | | | | | | | | | | | | | | |
|---|
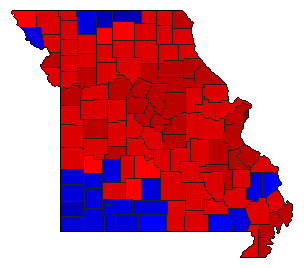
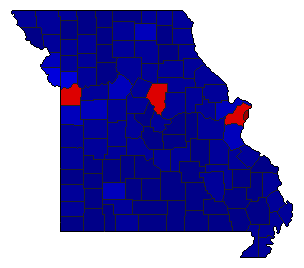 |  | 2020 |
2,951,605 |
2 |
1 |
0 |
635,079 |
21.52% |
37.87% |
59.38% |
0.00% |
2.75% |
1,117,713 |
1,752,792 |
0 |
81,100 |
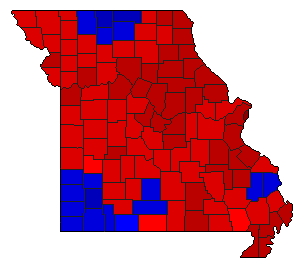
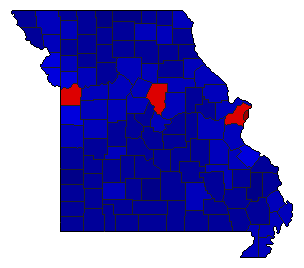 |  | 2016 |
2,747,802 |
2 |
1 |
0 |
467,298 |
17.01% |
41.50% |
58.50% |
0.00% |
0.00% |
1,140,252 |
1,607,550 |
0 |
0 |
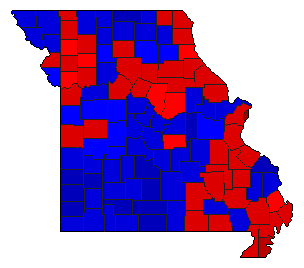
 | | 2012 |
2,668,064 |
1 |
2 |
0 |
407,033 |
15.26% |
55.89% |
40.63% |
0.00% |
3.48% |
1,491,139 |
1,084,106 |
0 |
92,819 |
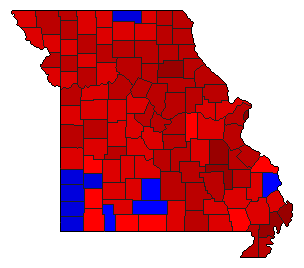
 | | 2008 |
2,776,465 |
1 |
2 |
0 |
157,011 |
5.66% |
52.83% |
47.17% |
0.00% |
0.00% |
1,466,738 |
1,309,727 |
0 |
0 |
 | | 2004 |
2,656,685 |
1 |
2 |
0 |
592,339 |
22.30% |
59.96% |
37.66% |
0.00% |
2.38% |
1,592,842 |
1,000,503 |
0 |
63,340 |
 | | 2000 |
2,287,473 |
1 |
2 |
0 |
522,482 |
22.84% |
60.25% |
37.41% |
0.00% |
2.33% |
1,378,296 |
855,814 |
0 |
53,363 |
 | | 1996 |
2,092,127 |
1 |
2 |
0 |
475,129 |
22.71% |
59.42% |
36.71% |
0.00% |
3.88% |
1,243,091 |
767,962 |
0 |
81,074 |
 | | 1992 |
2,312,104 |
1 |
2 |
0 |
89,900 |
3.89% |
49.94% |
46.05% |
0.00% |
4.00% |
1,154,714 |
1,064,814 |
0 |
92,576 |
 | | 1988 |
2,020,563 |
2 |
1 |
0 |
428,129 |
21.19% |
39.41% |
60.59% |
0.00% |
0.00% |
796,217 |
1,224,346 |
0 |
0 |
 | | 1984 |
2,033,109 |
2 |
1 |
0 |
230,321 |
11.33% |
44.34% |
55.66% |
0.00% |
0.00% |
901,394 |
1,131,715 |
0 |
0 |
 | | 1980 |
2,015,041 |
2 |
1 |
0 |
582,441 |
28.90% |
35.55% |
64.45% |
0.00% |
0.00% |
716,300 |
1,298,741 |
0 |
0 |
 | | 1976 |
1,877,945 |
2 |
1 |
0 |
45,619 |
2.43% |
48.79% |
51.21% |
0.00% |
0.00% |
916,163 |
961,782 |
0 |
0 |
 | | 1972 |
1,833,992 |
2 |
1 |
0 |
459,860 |
25.07% |
37.46% |
62.54% |
0.00% |
0.00% |
687,066 |
1,146,926 |
0 |
0 |
 | | 1968 |
1,710,863 |
2 |
1 |
0 |
72,133 |
4.22% |
47.89% |
52.11% |
0.00% |
0.00% |
819,365 |
891,498 |
0 |
0 |
 |  | 1900 |
682,640 |
1 |
2 |
5 |
38,452 |
5.63% |
51.64% |
46.01% |
0.63% |
1.72% |
352,517 |
314,065 |
4,296 |
11,762 |
 |  | 1896 |
673,399 |
1 |
2 |
3 |
35,899 |
5.33% |
50.58% |
45.25% |
3.57% |
0.60% |
340,585 |
304,686 |
24,063 |
4,065 |
 |  | 1892 |
540,951 |
1 |
2 |
3 |
39,741 |
7.35% |
49.52% |
42.17% |
7.55% |
0.75% |
267,885 |
228,144 |
40,856 |
4,066 |
|
