1900 General Election Results Comparison - Washington
| Map | Pie | Office | Total | D | R | I | Margin | %Margin | Dem | Rep | Ind | Oth. | Dem | Rep | Ind | Other |
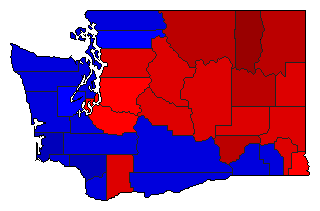
 |  | President | 107,524 | 2 | 1 | - | 12,623 | 11.74% | 41.70% | 53.44% | 0.00% | 4.87% | 44,833 | 57,456 | 0 | 5,235 |
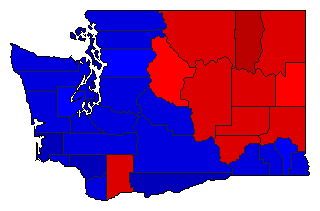
 | Governor | 106,521 | 1 | 2 | 0 | 2,188 | 2.05% | 48.86% | 46.81% | 0.00% | 4.33% | 52,048 | 49,860 | 0 | 4,613 | |
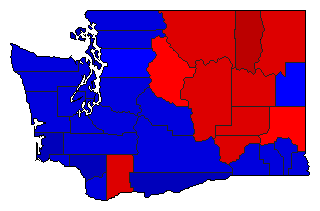
 |  | Lt. Governor | 105,428 | 2 | 1 | 3 | 7,004 | 6.64% | 44.17% | 50.82% | 2.25% | 2.76% | 46,570 | 53,574 | 2,373 | 2,911 |
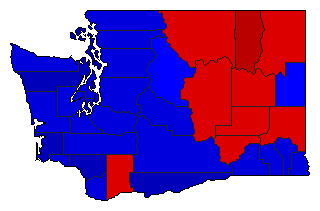
 |  | Secretary of State | 105,464 | 2 | 1 | 3 | 9,723 | 9.22% | 42.78% | 52.00% | 2.31% | 2.91% | 45,116 | 54,839 | 2,436 | 3,073 |
 |  | State Treasurer | 105,362 | 2 | 1 | 3 | 10,698 | 10.15% | 42.42% | 52.58% | 2.14% | 2.86% | 44,697 | 55,395 | 2,260 | 3,010 |
 |  | Attorney General | 105,501 | 2 | 1 | 3 | 9,534 | 9.04% | 42.94% | 51.98% | 2.24% | 2.84% | 45,307 | 54,841 | 2,361 | 2,992 |
 |  | Comptroller General | 105,254 | 2 | 1 | 3 | 10,128 | 9.62% | 42.55% | 52.17% | 2.40% | 2.87% | 44,787 | 54,915 | 2,528 | 3,024 |
 |  | State Auditor | 105,475 | 2 | 1 | 3 | 10,824 | 10.26% | 42.26% | 52.53% | 2.25% | 2.96% | 44,577 | 55,401 | 2,375 | 3,122 |
Washington Results for 1900
Login
© Dave Leip's Atlas of U.S. Elections, LLC 2019 All Rights Reserved
Note: The advertisement links below may advocate political positions that this site does not endorse.
Login
© Dave Leip's Atlas of U.S. Elections, LLC 2019 All Rights Reserved
Note: The advertisement links below may advocate political positions that this site does not endorse.