1900 General Election Results Comparison - Colorado
| Map | Pie | Office | Total | D | R | I | Margin | %Margin | Dem | Rep | Ind | Oth. | Dem | Rep | Ind | Other |
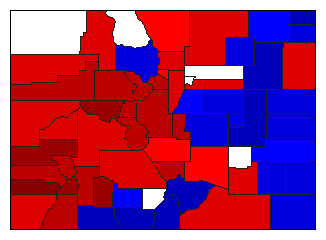
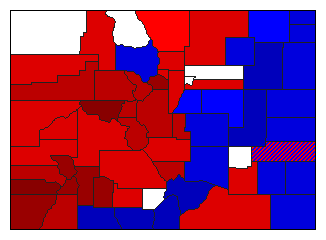
 |  | President | 221,408 | 1 | 2 | - | 29,661 | 13.40% | 55.43% | 42.04% | 0.00% | 2.53% | 122,733 | 93,072 | 0 | 5,603 |
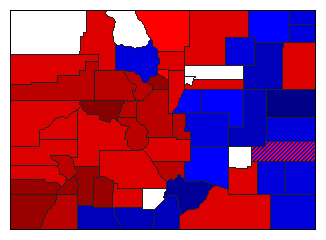
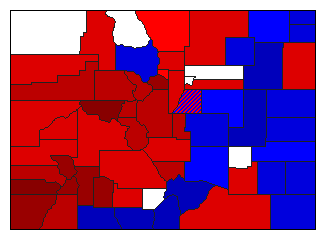
 |  | Governor | 218,634 | 1 | 2 | 3 | 24,594 | 11.25% | 54.26% | 43.02% | 1.69% | 1.03% | 118,641 | 94,047 | 3,695 | 2,251 |
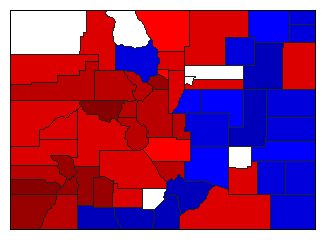
 |  | Lt. Governor | 219,967 | 1 | 2 | 3 | 25,028 | 11.38% | 54.20% | 42.82% | 1.80% | 1.17% | 119,226 | 94,198 | 3,968 | 2,575 |
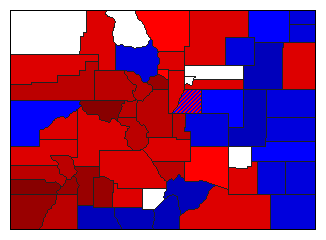
 |  | Secretary of State | 219,909 | 1 | 2 | 3 | 25,982 | 11.81% | 54.56% | 42.75% | 1.89% | 0.80% | 119,992 | 94,010 | 4,146 | 1,761 |
 |  | State Treasurer | 219,271 | 1 | 2 | 3 | 25,971 | 11.84% | 54.63% | 42.79% | 1.75% | 0.83% | 119,791 | 93,820 | 3,836 | 1,824 |
 |  | Attorney General | 217,964 | 1 | 2 | 3 | 25,616 | 11.75% | 54.74% | 42.99% | 1.85% | 0.43% | 119,311 | 93,695 | 4,026 | 932 |
 |  | State Auditor | 218,891 | 1 | 2 | 3 | 25,548 | 11.67% | 54.51% | 42.84% | 1.84% | 0.82% | 119,310 | 93,762 | 4,031 | 1,788 |
Colorado Results for 1900
Login
© Dave Leip's Atlas of U.S. Elections, LLC 2019 All Rights Reserved
Note: The advertisement links below may advocate political positions that this site does not endorse.
Login
© Dave Leip's Atlas of U.S. Elections, LLC 2019 All Rights Reserved
Note: The advertisement links below may advocate political positions that this site does not endorse.