Note: The Google advertisement links below may advocate political positions that this site does not endorse.
| Map | Pie | Office | Total | D | R | I | Margin | %Margin | Dem | Rep | Ind | Oth. | Dem | Rep | Ind | Other | | | | | | | | | | | | | | | | | | |
|---|
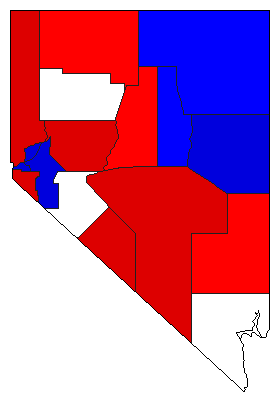
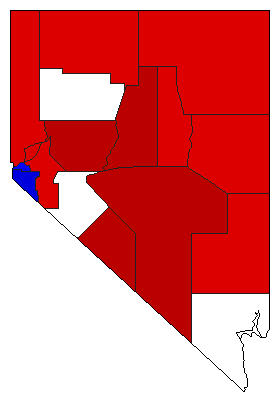 | | Governor |
14,837 |
1 |
2 |
0 |
3,350 |
22.58% |
58.54% |
35.96% |
0.00% |
5.49% |
8,686 |
5,336 |
0 |
815 |
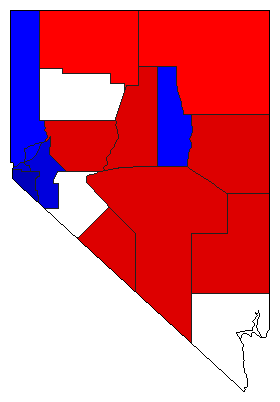 | | Lt. Governor |
14,275 |
1 |
2 |
0 |
709 |
4.97% |
47.98% |
43.01% |
0.00% |
9.01% |
6,849 |
6,140 |
0 |
1,286 |
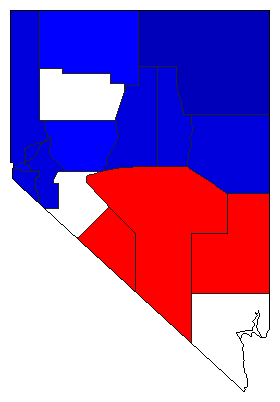
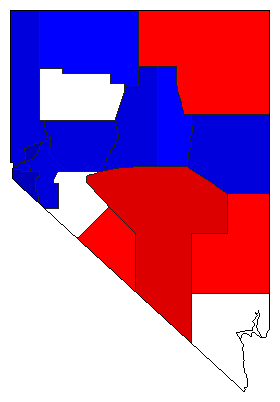 | | Secretary of State |
14,363 |
2 |
1 |
0 |
583 |
4.06% |
43.74% |
47.80% |
0.00% |
8.45% |
6,283 |
6,866 |
0 |
1,214 |
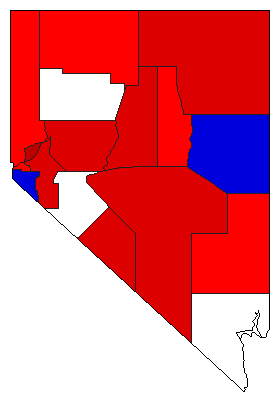 | | State Treasurer |
14,346 |
1 |
2 |
0 |
1,676 |
11.68% |
51.03% |
39.35% |
0.00% |
9.62% |
7,321 |
5,645 |
0 |
1,380 |
 | | Attorney General |
14,442 |
1 |
2 |
0 |
1,012 |
7.01% |
49.33% |
42.32% |
0.00% |
8.35% |
7,124 |
6,112 |
0 |
1,206 |
 | | Controller |
14,219 |
2 |
1 |
0 |
475 |
3.34% |
43.85% |
47.19% |
0.00% |
8.96% |
6,235 |
6,710 |
0 |
1,274 |
|
