1908 General Election Results Comparison - Washington
| Map | Pie | Office | Total | D | R | I | Margin | %Margin | Dem | Rep | Ind | Oth. | Dem | Rep | Ind | Other |
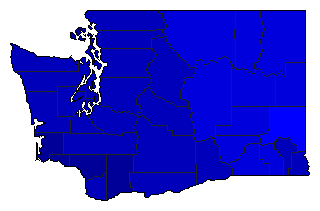
 |  | President | 183,879 | 2 | 1 | - | 47,371 | 25.76% | 31.92% | 57.68% | 0.00% | 10.40% | 58,691 | 106,062 | 0 | 19,126 |
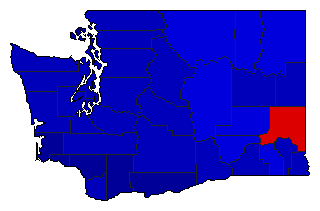
 | Governor | 176,141 | 2 | 1 | 0 | 52,064 | 29.56% | 33.00% | 62.56% | 0.00% | 4.44% | 58,126 | 110,190 | 0 | 7,825 | |
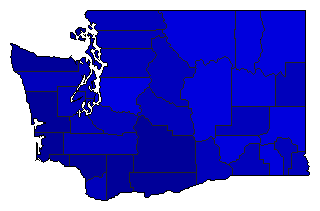
 |  | Lt. Governor | 173,719 | 2 | 1 | 3 | 50,682 | 29.17% | 34.10% | 63.27% | 2.55% | 0.08% | 59,232 | 109,914 | 4,435 | 138 |
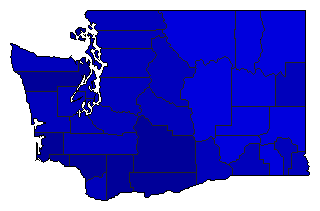
 |  | Secretary of State | 171,293 | 2 | 1 | 3 | 51,904 | 30.30% | 33.52% | 63.82% | 2.58% | 0.08% | 57,420 | 109,324 | 4,417 | 132 |
 |  | State Treasurer | 171,080 | 2 | 1 | 3 | 51,899 | 30.34% | 33.51% | 63.85% | 2.56% | 0.08% | 57,333 | 109,232 | 4,377 | 138 |
 |  | Attorney General | 170,694 | 2 | 1 | 3 | 55,921 | 32.76% | 32.30% | 65.06% | 2.55% | 0.08% | 55,138 | 111,059 | 4,358 | 139 |
 |  | Comptroller General | 170,949 | 2 | 1 | 3 | 49,819 | 29.14% | 34.10% | 63.24% | 2.58% | 0.08% | 58,294 | 108,113 | 4,412 | 130 |
 |  | State Auditor | 170,698 | 2 | 1 | 3 | 54,279 | 31.80% | 32.77% | 64.56% | 2.59% | 0.08% | 55,932 | 110,211 | 4,415 | 140 |
 |  | Insurance Commissioner | 169,627 | 2 | 1 | 3 | 49,266 | 29.04% | 34.15% | 63.19% | 2.58% | 0.08% | 57,929 | 107,195 | 4,373 | 130 |
Washington Results for 1908
Login
© Dave Leip's Atlas of U.S. Elections, LLC 2019 All Rights Reserved
Note: The advertisement links below may advocate political positions that this site does not endorse.
Login
© Dave Leip's Atlas of U.S. Elections, LLC 2019 All Rights Reserved
Note: The advertisement links below may advocate political positions that this site does not endorse.