| Map | Pie | Year | Total | D | R | I | Margin | %Margin | Dem | Rep | Ind | Oth. | Dem | Rep | Ind | Other | | | | | | | | | | | | | | | | | | |
|---|
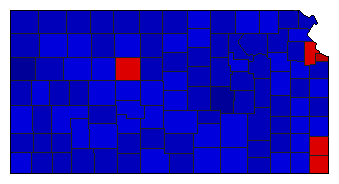 |  | 1972 |
861,138 |
2 |
1 |
0 |
138,204 |
16.05% |
40.86% |
56.91% |
0.00% |
2.23% |
351,869 |
490,073 |
0 |
19,196 |
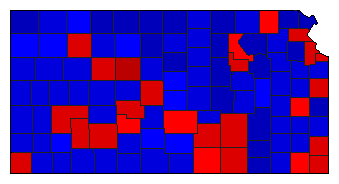 |  | 1970 |
693,643 |
2 |
1 |
0 |
8,489 |
1.22% |
47.80% |
49.02% |
0.00% |
3.19% |
331,530 |
340,019 |
0 |
22,094 |
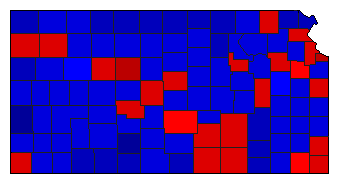 |  | 1968 |
810,363 |
1 |
2 |
0 |
4,206 |
0.52% |
49.44% |
48.92% |
0.00% |
1.64% |
400,641 |
396,435 |
0 |
13,287 |
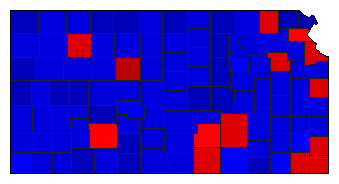
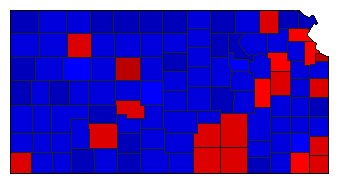 |  | 1966 |
652,521 |
2 |
1 |
0 |
17,922 |
2.75% |
47.08% |
49.83% |
0.00% |
3.10% |
307,200 |
325,122 |
0 |
20,199 |
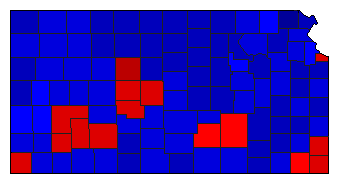
 |  | 1964 |
800,294 |
2 |
1 |
0 |
35,379 |
4.42% |
46.33% |
50.75% |
0.00% |
2.92% |
370,777 |
406,156 |
0 |
23,361 |
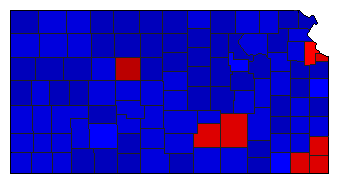
 |  | 1962 |
605,604 |
2 |
1 |
0 |
65,626 |
10.84% |
43.49% |
54.33% |
0.00% |
2.19% |
263,371 |
328,997 |
0 |
13,236 |
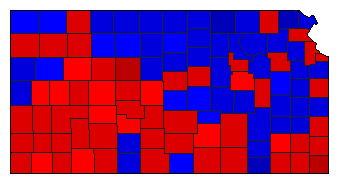
 |  | 1960 |
865,943 |
2 |
1 |
0 |
79,087 |
9.13% |
44.60% |
53.73% |
0.00% |
1.67% |
386,208 |
465,295 |
0 |
14,440 |
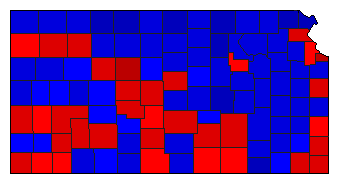
 |  | 1958 |
674,121 |
1 |
2 |
0 |
30,958 |
4.59% |
50.17% |
45.57% |
0.00% |
4.26% |
338,183 |
307,225 |
0 |
28,713 |
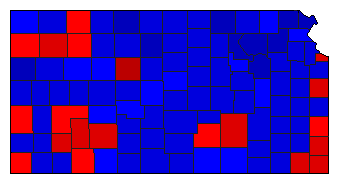
 |  | 1956 |
804,402 |
1 |
2 |
0 |
11,413 |
1.42% |
49.28% |
47.86% |
0.00% |
2.85% |
396,428 |
385,015 |
0 |
22,959 |
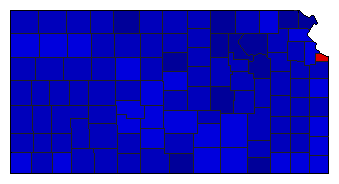
 |  | 1954 |
592,885 |
2 |
1 |
0 |
32,907 |
5.55% |
44.78% |
50.33% |
0.00% |
4.90% |
265,467 |
298,374 |
0 |
29,044 |
 |  | 1952 |
829,897 |
2 |
1 |
0 |
191,489 |
23.07% |
37.27% |
60.34% |
0.00% |
2.39% |
309,280 |
500,769 |
0 |
19,848 |
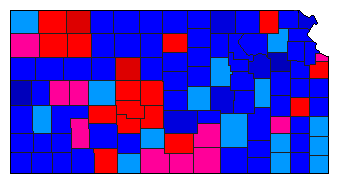
 |  | 1950 |
586,183 |
2 |
1 |
0 |
83,690 |
14.28% |
41.40% |
55.68% |
0.00% |
2.91% |
242,708 |
326,398 |
0 |
17,077 |
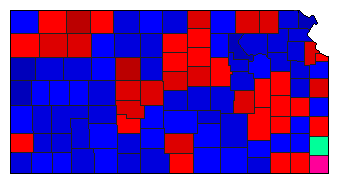
 |  | 1914 |
485,052 |
2 |
1 |
3 |
28,312 |
5.84% |
35.42% |
41.26% |
13.76% |
9.56% |
171,828 |
200,140 |
66,720 |
46,364 |
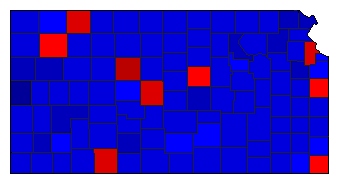
 |  | 1912 |
347,927 |
2 |
1 |
3 |
6,427 |
1.85% |
45.36% |
47.21% |
7.41% |
0.02% |
157,829 |
164,256 |
25,780 |
62 |
 |  | 1910 |
313,893 |
2 |
1 |
3 |
35,128 |
11.19% |
41.38% |
52.57% |
5.17% |
0.88% |
129,888 |
165,016 |
16,238 |
2,751 |
|