| Map | Pie | Office | Total | D | R | I | Margin | %Margin | Dem | Rep | Ind | Oth. | Dem | Rep | Ind | Other | | | | | | | | | | | | | | | | | | |
|---|
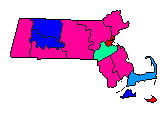
 |  | President |
488,057 |
1 |
2 |
3 |
17,460 |
3.58% |
35.53% |
31.95% |
29.14% |
3.38% |
173,408 |
155,948 |
142,228 |
16,473 |
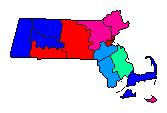
 | | Governor |
475,792 |
1 |
2 |
3 |
49,587 |
10.42% |
40.60% |
30.18% |
25.77% |
3.45% |
193,184 |
143,597 |
122,602 |
16,409 |
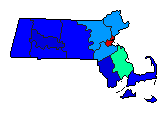
 | | Lt. Governor |
461,524 |
1 |
2 |
3 |
33,621 |
7.28% |
41.11% |
33.82% |
20.84% |
4.23% |
189,719 |
156,098 |
96,168 |
19,539 |
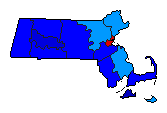
 | | Secretary of State |
442,992 |
1 |
2 |
3 |
4,247 |
0.96% |
37.61% |
36.65% |
21.06% |
4.69% |
166,591 |
162,344 |
93,293 |
20,764 |
 | | State Treasurer |
438,657 |
2 |
1 |
3 |
9,224 |
2.10% |
35.78% |
37.88% |
21.12% |
5.22% |
156,944 |
166,168 |
92,637 |
22,908 |
 | | Attorney General |
440,450 |
2 |
1 |
3 |
4,087 |
0.93% |
37.34% |
38.27% |
19.81% |
4.58% |
164,470 |
168,557 |
87,239 |
20,184 |
 | | State Auditor |
435,697 |
2 |
1 |
3 |
6,941 |
1.59% |
36.59% |
38.18% |
20.18% |
5.05% |
159,406 |
166,347 |
87,935 |
22,009 |
|
