| Map | Pie | Office | Total | D | R | I | Margin | %Margin | Dem | Rep | Ind | Oth. | Dem | Rep | Ind | Other | | | | | | | | | | | | | | | | | | |
|---|
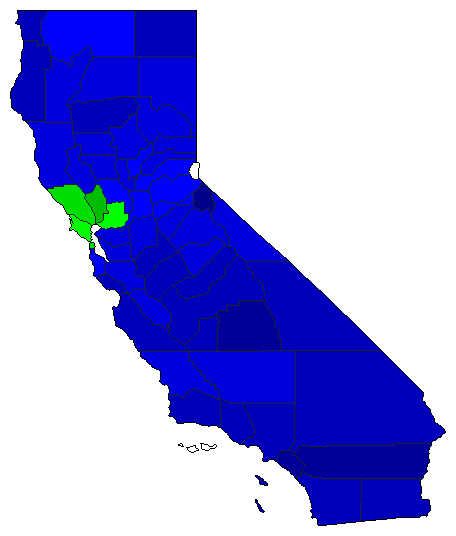 |  | Governor |
688,670 |
0 |
1 |
2 |
136,358 |
19.80% |
0.00% |
56.27% |
36.47% |
7.25% |
0 |
387,547 |
251,189 |
49,934 |
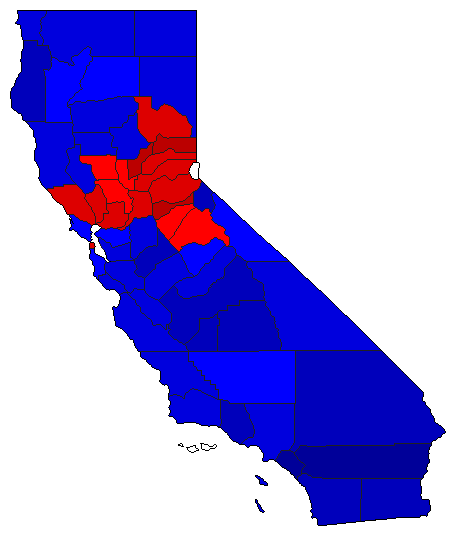 |  | Lt. Governor |
656,848 |
2 |
1 |
3 |
95,832 |
14.59% |
39.49% |
54.08% |
6.42% |
0.00% |
259,415 |
355,247 |
42,161 |
25 |
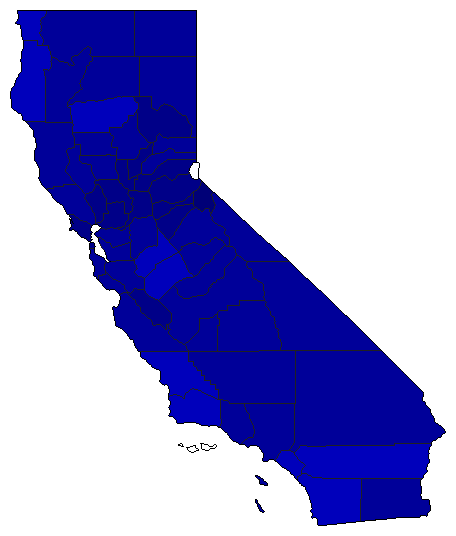
 |  | Secretary of State |
618,485 |
0 |
1 |
2 |
339,514 |
54.89% |
0.00% |
77.45% |
22.55% |
0.00% |
0 |
478,989 |
139,475 |
21 |
 |  | State Treasurer |
613,068 |
0 |
1 |
3 |
392,473 |
64.02% |
0.00% |
78.19% |
7.64% |
14.17% |
0 |
479,333 |
46,867 |
86,868 |
 |  | Attorney General |
617,170 |
0 |
1 |
3 |
390,851 |
63.33% |
0.00% |
77.93% |
7.46% |
14.61% |
0 |
480,981 |
46,043 |
90,146 |
 |  | Controller |
617,127 |
0 |
1 |
3 |
361,725 |
58.61% |
0.00% |
75.31% |
7.99% |
16.70% |
0 |
464,764 |
49,317 |
103,046 |
|
