| Map | Pie | Office | Total | D | R | I | Margin | %Margin | Dem | Rep | Ind | Oth. | Dem | Rep | Ind | Other | | | | | | | | | | | | | | | | | | |
|---|
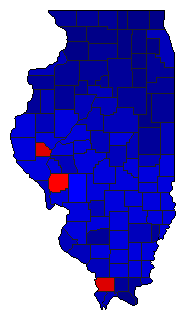
 |  | President |
2,094,714 |
2 |
1 |
- |
886,085 |
42.30% |
25.51% |
67.81% |
0.00% |
6.68% |
534,395 |
1,420,480 |
0 |
139,839 |
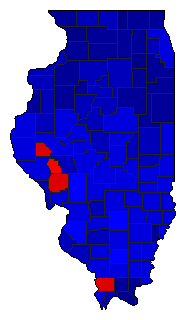
 |  | Senator |
2,067,045 |
2 |
1 |
3 |
827,012 |
40.01% |
26.82% |
66.83% |
3.22% |
3.14% |
554,372 |
1,381,384 |
66,463 |
64,826 |
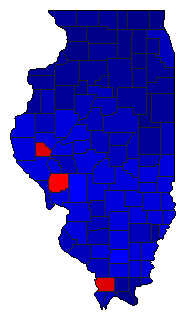
 | | Governor |
2,111,609 |
2 |
1 |
3 |
511,597 |
24.23% |
34.64% |
58.87% |
2.79% |
3.69% |
731,551 |
1,243,148 |
58,998 |
77,912 |
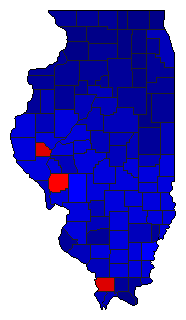
 |  | Lt. Governor |
2,071,290 |
2 |
1 |
3 |
715,493 |
34.54% |
29.63% |
64.17% |
3.11% |
3.10% |
613,626 |
1,329,119 |
64,342 |
64,203 |
 |  | Secretary of State |
2,077,629 |
2 |
1 |
3 |
797,975 |
38.41% |
27.66% |
66.07% |
3.18% |
3.09% |
574,658 |
1,372,633 |
66,146 |
64,192 |
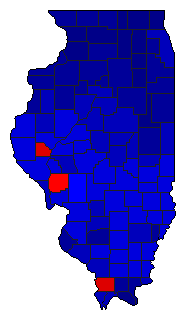 |  | State Treasurer |
2,074,909 |
2 |
1 |
3 |
772,429 |
37.23% |
28.25% |
65.48% |
3.16% |
3.11% |
586,155 |
1,358,584 |
65,657 |
64,513 |
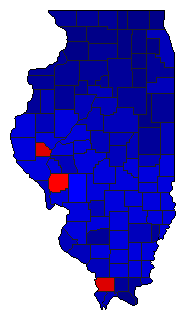 |  | Attorney General |
2,078,600 |
2 |
1 |
3 |
826,462 |
39.76% |
27.02% |
66.78% |
3.14% |
3.07% |
561,545 |
1,388,007 |
65,174 |
63,874 |
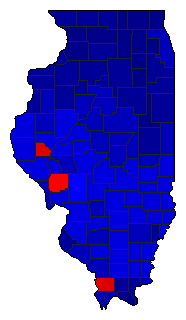 |  | State Auditor |
2,075,109 |
2 |
1 |
3 |
832,849 |
40.14% |
26.80% |
66.94% |
3.17% |
3.09% |
556,131 |
1,388,980 |
65,819 |
64,179 |
|