| Map | Pie | Office | Total | D | R | I | Margin | %Margin | Dem | Rep | Ind | Oth. | Dem | Rep | Ind | Other | | | | | | | | | | | | | | | | | | |
|---|
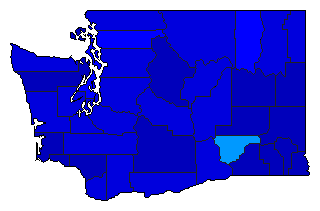
 |  | President |
398,715 |
2 |
1 |
- |
138,839 |
34.82% |
21.14% |
55.96% |
0.00% |
22.89% |
84,298 |
223,137 |
0 |
91,280 |
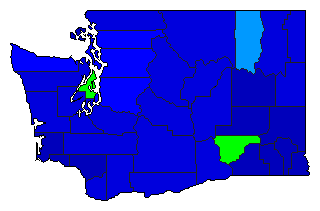
 | | Senator |
384,866 |
3 |
1 |
2 |
117,760 |
30.60% |
17.80% |
56.40% |
25.80% |
0.00% |
68,488 |
217,069 |
99,309 |
0 |
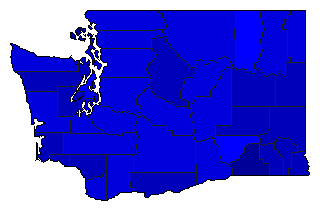
 | | Governor |
399,408 |
3 |
1 |
2 |
89,291 |
22.36% |
16.54% |
52.74% |
30.39% |
0.32% |
66,079 |
210,662 |
121,371 |
1,296 |
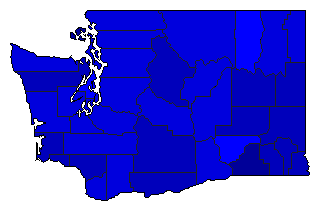
 | | Lt. Governor |
382,168 |
3 |
1 |
2 |
117,078 |
30.64% |
14.92% |
57.86% |
27.22% |
0.00% |
57,002 |
221,122 |
104,044 |
0 |
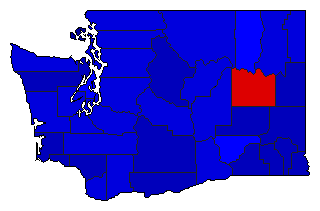
 | | Secretary of State |
377,227 |
3 |
1 |
2 |
118,304 |
31.36% |
15.31% |
58.02% |
26.66% |
0.00% |
57,771 |
218,880 |
100,576 |
0 |
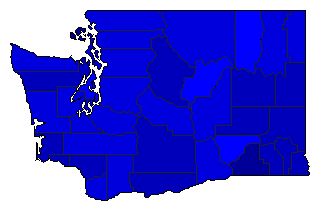
 | | State Treasurer |
377,570 |
3 |
1 |
2 |
116,235 |
30.79% |
16.26% |
57.26% |
26.48% |
0.00% |
61,375 |
216,215 |
99,980 |
0 |
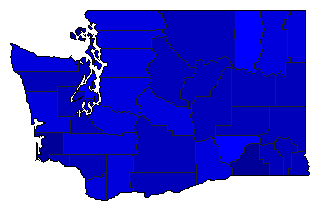
 | | Attorney General |
375,968 |
3 |
1 |
2 |
116,391 |
30.96% |
15.75% |
57.60% |
26.64% |
0.00% |
59,227 |
216,566 |
100,175 |
0 |
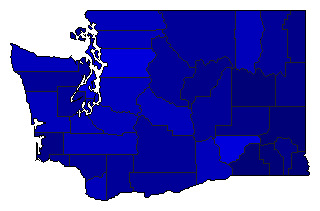
 |  | Comptroller General |
376,254 |
3 |
1 |
2 |
123,052 |
32.70% |
14.82% |
58.94% |
26.24% |
0.00% |
55,766 |
221,770 |
98,718 |
0 |
 | | State Auditor |
327,916 |
0 |
1 |
2 |
125,420 |
38.25% |
0.00% |
69.12% |
30.88% |
0.00% |
0 |
226,668 |
101,248 |
0 |
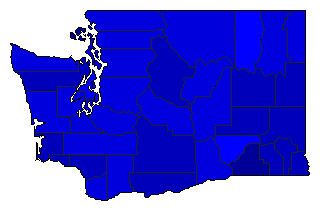 |  | Insurance Commissioner |
374,916 |
3 |
1 |
2 |
120,879 |
32.24% |
15.75% |
58.25% |
26.01% |
0.00% |
59,041 |
218,377 |
97,498 |
0 |
|


