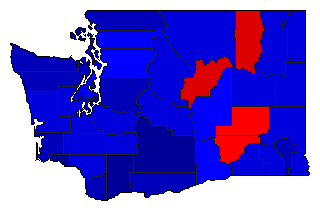
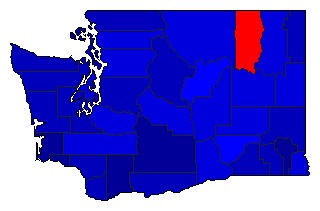
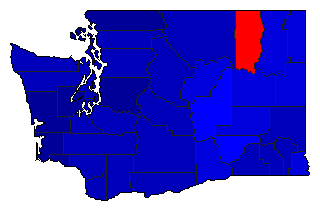
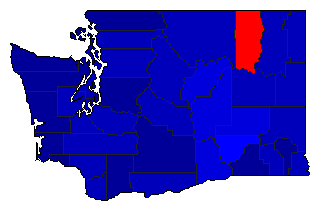
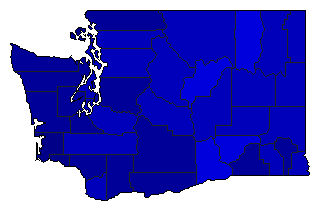
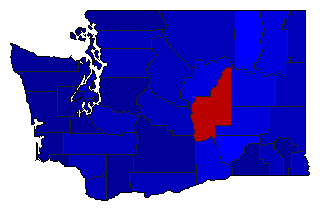
1924 General Election Results Comparison - Washington
| Map | Pie | Office | Total | D | R | I | Margin | %Margin | Dem | Rep | Ind | Oth. | Dem | Rep | Ind | Other |
 |  | President | 421,549 | 3 | 1 | 2 | 69,497 | 16.49% | 10.16% | 52.24% | 35.76% | 1.84% | 42,842 | 220,224 | 150,727 | 7,756 |
 | Governor | 390,304 | 2 | 1 | 3 | 93,715 | 24.01% | 32.40% | 56.41% | 10.27% | 0.93% | 126,447 | 220,162 | 40,073 | 3,622 | |
 |  | Lt. Governor | 355,363 | 2 | 1 | 3 | 131,205 | 36.92% | 26.26% | 63.18% | 9.89% | 0.66% | 93,318 | 224,523 | 35,159 | 2,363 |
 |  | Secretary of State | 349,623 | 2 | 1 | 3 | 178,090 | 50.94% | 19.13% | 70.06% | 10.39% | 0.42% | 66,869 | 244,959 | 36,317 | 1,478 |
 |  | State Treasurer | 346,010 | 2 | 1 | 3 | 146,650 | 42.38% | 23.37% | 65.76% | 10.51% | 0.36% | 80,873 | 227,523 | 36,379 | 1,235 |
 |  | Attorney General | 341,498 | 2 | 1 | 3 | 165,926 | 48.59% | 20.43% | 69.02% | 10.18% | 0.37% | 69,776 | 235,702 | 34,766 | 1,254 |
 |  | Comptroller General | 344,240 | 2 | 1 | 3 | 178,076 | 51.73% | 18.75% | 70.48% | 10.43% | 0.34% | 64,530 | 242,606 | 35,917 | 1,187 |
 |  | State Auditor | 345,669 | 2 | 1 | 3 | 162,058 | 46.88% | 21.30% | 68.18% | 10.14% | 0.39% | 73,615 | 235,673 | 35,035 | 1,346 |
 |  | Insurance Commissioner | 340,116 | 2 | 1 | 3 | 163,855 | 48.18% | 20.76% | 68.93% | 9.93% | 0.38% | 70,600 | 234,455 | 33,782 | 1,279 |
| Map | Pie | Initiative | Total Vote | N | Y | Margin | %Margin | No | Yes | Oth. | No | Yes | ||||
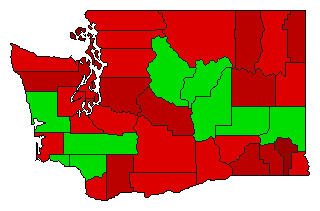 | Initiative | 380,422 | 1 | 0 | 2 | 62,578 | 16.45% | 58.22% | 0.00% | 41.78% | 0.00% | 221,500 | 0 | 158,922 | 0 | |
Washington Results for 1924
Login
© Dave Leip's Atlas of U.S. Elections, LLC 2019 All Rights Reserved
Note: The advertisement links below may advocate political positions that this site does not endorse.
Login
© Dave Leip's Atlas of U.S. Elections, LLC 2019 All Rights Reserved
Note: The advertisement links below may advocate political positions that this site does not endorse.