1928 General Election Results Comparison - California
| Map | Pie | Office | Total | D | R | I | Margin | %Margin | Dem | Rep | Ind | Oth. | Dem | Rep | Ind | Other |
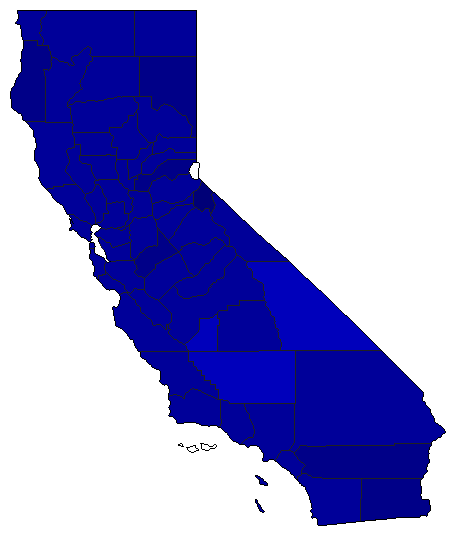
 |  | President | 1,796,656 | 2 | 1 | - | 547,958 | 30.50% | 34.19% | 64.69% | 0.00% | 1.11% | 614,365 | 1,162,323 | 0 | 19,968 |
 |  | Senator | 1,549,796 | 2 | 1 | 3 | 865,986 | 55.88% | 18.22% | 74.10% | 5.94% | 1.73% | 282,411 | 1,148,397 | 92,106 | 26,882 |
California Results for 1928
Login
© Dave Leip's Atlas of U.S. Elections, LLC 2019 All Rights Reserved
Note: The advertisement links below may advocate political positions that this site does not endorse.
Login
© Dave Leip's Atlas of U.S. Elections, LLC 2019 All Rights Reserved
Note: The advertisement links below may advocate political positions that this site does not endorse.