| Map | Pie | Office | Total | D | R | I | Margin | %Margin | Dem | Rep | Ind | Oth. | Dem | Rep | Ind | Other | | | | | | | | | | | | | | | | | | |
|---|
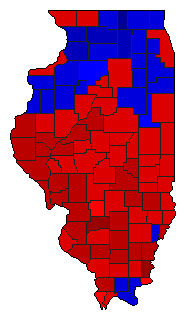
 |  | President |
3,407,926 |
1 |
2 |
- |
449,548 |
13.19% |
55.23% |
42.04% |
0.00% |
2.73% |
1,882,304 |
1,432,756 |
0 |
92,866 |
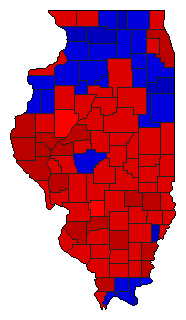
 |  | Senator |
3,198,151 |
1 |
2 |
0 |
198,625 |
6.21% |
52.23% |
46.02% |
0.00% |
1.75% |
1,670,466 |
1,471,841 |
0 |
55,844 |
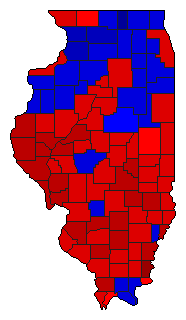
 | | Governor |
3,350,306 |
1 |
2 |
6 |
566,287 |
16.90% |
57.62% |
40.71% |
0.04% |
1.63% |
1,930,330 |
1,364,043 |
1,182 |
54,751 |
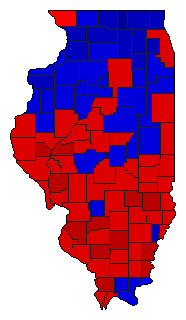
 |  | Lt. Governor |
3,184,652 |
1 |
2 |
3 |
242,132 |
7.60% |
52.95% |
45.35% |
1.20% |
0.51% |
1,686,265 |
1,444,133 |
38,163 |
16,091 |
 |  | Secretary of State |
3,210,713 |
1 |
2 |
3 |
59,148 |
1.84% |
50.08% |
48.24% |
1.18% |
0.50% |
1,607,954 |
1,548,806 |
37,907 |
16,046 |
 |  | State Treasurer |
3,178,849 |
1 |
2 |
3 |
128,728 |
4.05% |
51.17% |
47.12% |
1.21% |
0.50% |
1,626,659 |
1,497,931 |
38,308 |
15,951 |
 |  | Attorney General |
3,173,007 |
1 |
2 |
3 |
184,245 |
5.81% |
52.05% |
46.25% |
1.19% |
0.50% |
1,651,683 |
1,467,438 |
37,865 |
16,021 |
 |  | State Auditor |
3,180,495 |
1 |
2 |
3 |
298,356 |
9.38% |
53.83% |
44.45% |
1.22% |
0.50% |
1,711,969 |
1,413,613 |
38,865 |
16,048 |
|
