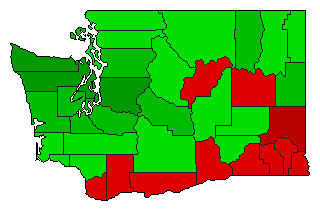
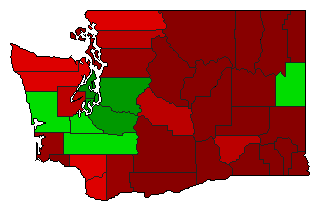
1932 General Election Results Comparison - Washington
| Map | Pie | Office | Total | D | R | I | Margin | %Margin | Dem | Rep | Ind | Oth. | Dem | Rep | Ind | Other |
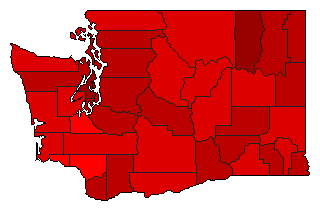
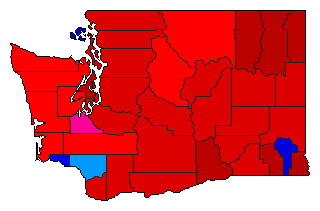
 |  | President | 614,814 | 1 | 2 | - | 144,615 | 23.52% | 57.46% | 33.94% | 0.00% | 8.61% | 353,260 | 208,645 | 0 | 52,909 |
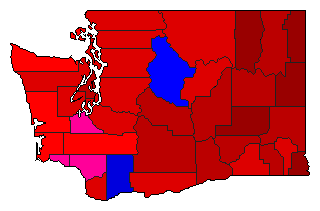
 | Senator | 603,795 | 1 | 2 | 0 | 168,489 | 27.91% | 60.61% | 32.70% | 0.00% | 6.69% | 365,939 | 197,450 | 0 | 40,406 | |
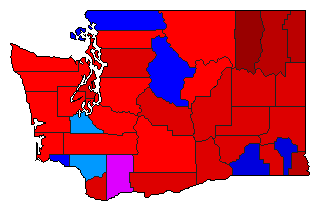
 | Governor | 614,768 | 1 | 2 | 7 | 144,718 | 23.54% | 57.29% | 33.75% | 0.06% | 8.89% | 352,215 | 207,497 | 378 | 54,678 | |
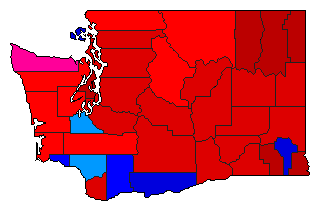
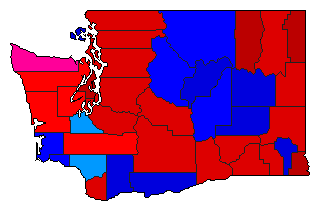
 |  | Lt. Governor | 583,662 | 1 | 2 | 5 | 42,923 | 7.35% | 49.07% | 41.72% | 0.11% | 9.11% | 286,402 | 243,479 | 613 | 53,168 |
 |  | Secretary of State | 571,899 | 1 | 2 | 0 | 77,828 | 13.61% | 52.35% | 38.75% | 0.00% | 8.90% | 299,417 | 221,589 | 0 | 50,893 |
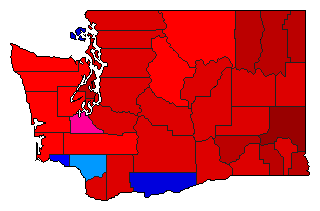
 |  | State Treasurer | 571,009 | 1 | 2 | 0 | 83,656 | 14.65% | 53.57% | 38.92% | 0.00% | 7.51% | 305,905 | 222,249 | 0 | 42,855 |
 |  | Attorney General | 560,256 | 1 | 2 | 0 | 92,248 | 16.47% | 54.40% | 37.94% | 0.00% | 7.66% | 304,793 | 212,545 | 0 | 42,918 |
 |  | Comptroller General | 565,919 | 1 | 2 | 3 | 73,669 | 13.02% | 52.79% | 39.77% | 7.44% | 0.00% | 298,731 | 225,062 | 42,126 | 0 |
 |  | State Auditor | 563,545 | 1 | 2 | 0 | 89,956 | 15.96% | 54.06% | 38.10% | 0.00% | 7.84% | 304,650 | 214,694 | 0 | 44,201 |
 |  | Insurance Commissioner | 520,957 | 1 | 2 | 0 | 80,259 | 15.41% | 57.70% | 42.30% | 0.00% | 0.00% | 300,608 | 220,349 | 0 | 0 |
| Map | Pie | Initiative | Total Vote | N | Y | Margin | %Margin | No | Yes | Oth. | No | Yes | ||||
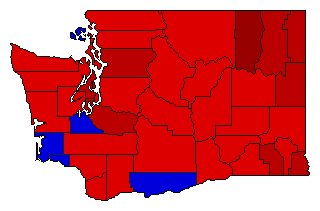
 | Initiative | 549,661 | 2 | 0 | 1 | 133,239 | 24.24% | 37.88% | 0.00% | 62.12% | 0.00% | 208,211 | 0 | 341,450 | 0 | |
 | Initiative | 502,284 | 2 | 0 | 1 | 38,558 | 7.68% | 46.16% | 0.00% | 53.84% | 0.00% | 231,863 | 0 | 270,421 | 0 | |
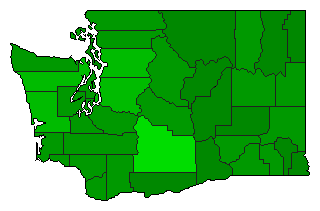 | Initiative | 459,902 | 2 | 0 | 1 | 185,936 | 40.43% | 29.79% | 0.00% | 70.21% | 0.00% | 136,983 | 0 | 322,919 | 0 | |
Washington Results for 1932
Login
© Dave Leip's Atlas of U.S. Elections, LLC 2019 All Rights Reserved
Note: The advertisement links below may advocate political positions that this site does not endorse.
Login
© Dave Leip's Atlas of U.S. Elections, LLC 2019 All Rights Reserved
Note: The advertisement links below may advocate political positions that this site does not endorse.