| Map | Pie | Office | Total | D | R | I | Margin | %Margin | Dem | Rep | Ind | Oth. | Dem | Rep | Ind | Other | | | | | | | | | | | | | | | | | | |
|---|
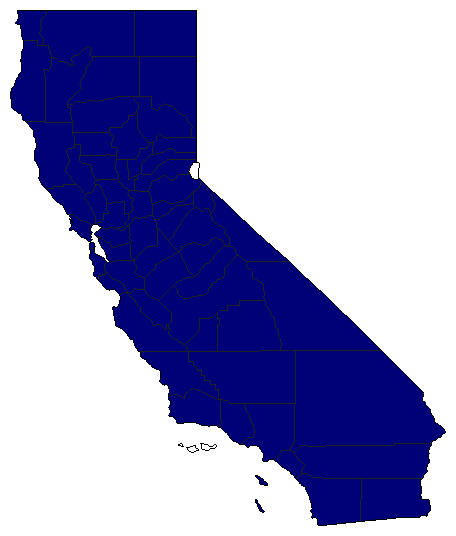 |  | Senator |
2,058,940 |
0 |
1 |
2 |
1,837,824 |
89.26% |
0.00% |
94.54% |
5.28% |
0.18% |
0 |
1,946,572 |
108,748 |
3,620 |
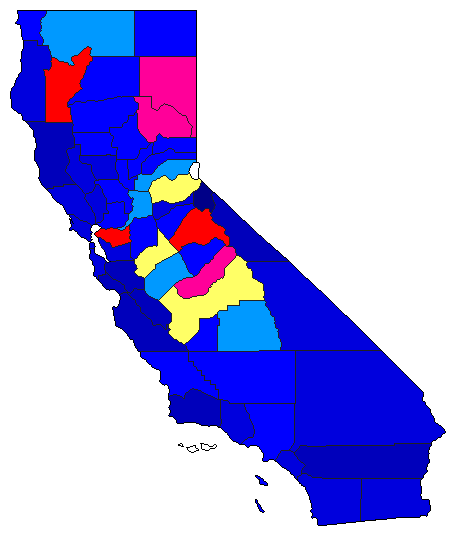 | | Governor |
2,329,722 |
2 |
1 |
4 |
259,083 |
11.12% |
37.75% |
48.87% |
0.25% |
13.12% |
879,537 |
1,138,620 |
5,826 |
305,739 |
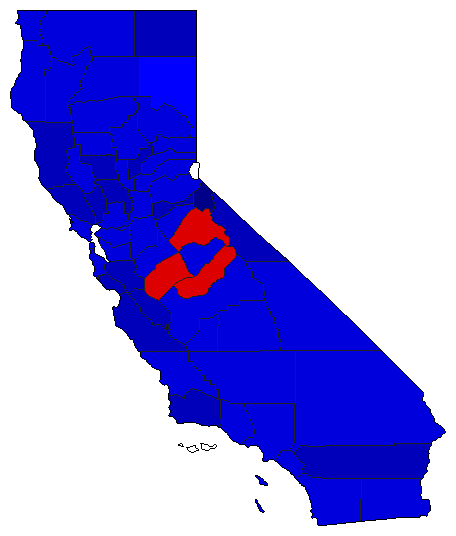 |  | Lt. Governor |
2,249,694 |
2 |
1 |
3 |
217,683 |
9.68% |
44.58% |
54.25% |
0.70% |
0.47% |
1,002,832 |
1,220,515 |
15,741 |
10,606 |
 |  | Secretary of State |
2,112,941 |
0 |
1 |
2 |
1,712,344 |
81.04% |
0.00% |
89.38% |
8.34% |
2.27% |
0 |
1,888,620 |
176,276 |
48,045 |
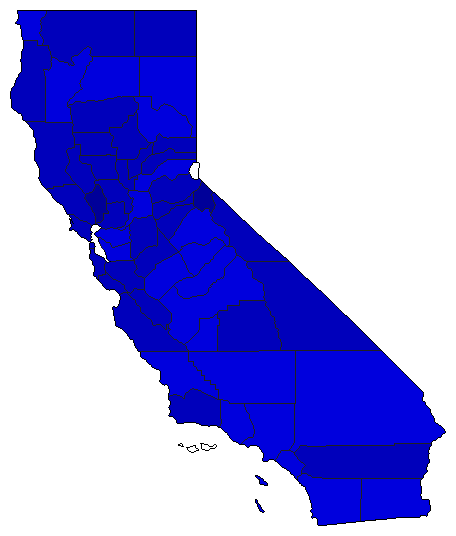 |  | State Treasurer |
2,122,136 |
2 |
1 |
3 |
328,034 |
15.46% |
41.66% |
57.12% |
1.21% |
0.01% |
884,125 |
1,212,159 |
25,725 |
127 |
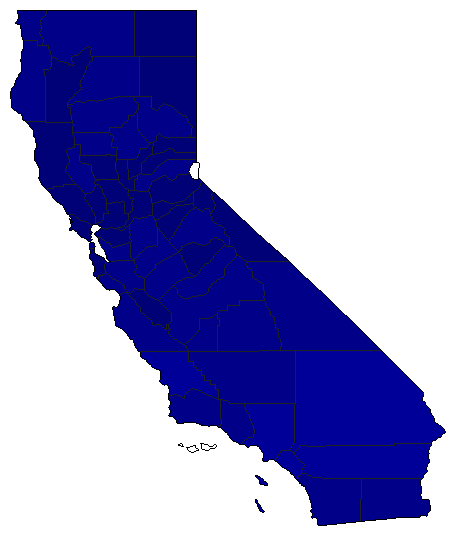 |  | Attorney General |
2,061,534 |
0 |
1 |
2 |
1,267,170 |
61.47% |
0.00% |
80.72% |
19.25% |
0.03% |
0 |
1,664,022 |
396,852 |
660 |
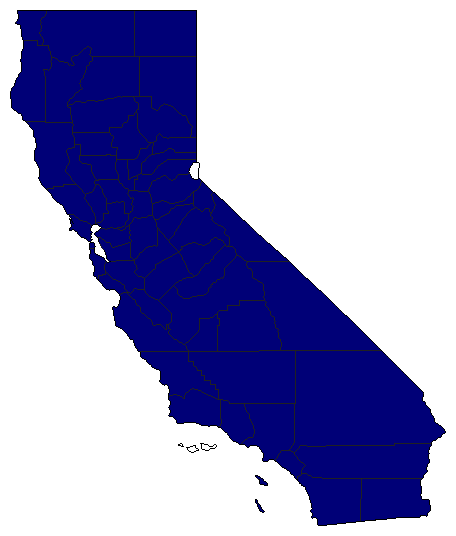 |  | Controller |
2,042,854 |
0 |
1 |
2 |
1,827,215 |
89.44% |
0.00% |
94.38% |
4.94% |
0.69% |
0 |
1,928,035 |
100,820 |
13,999 |
|


