1936 General Election Results Comparison - Massachusetts
| Map | Pie | Office | Total | D | R | I | Margin | %Margin | Dem | Rep | Ind | Oth. | Dem | Rep | Ind | Other |
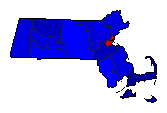
 |  | President | 1,840,357 | 1 | 2 | - | 174,103 | 9.46% | 51.22% | 41.76% | 0.00% | 7.01% | 942,716 | 768,613 | 0 | 129,028 |
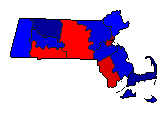
 | Senator | 1,803,341 | 2 | 1 | 3 | 135,409 | 7.51% | 41.02% | 48.53% | 7.44% | 3.00% | 739,751 | 875,160 | 134,245 | 54,185 | |
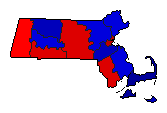
 | Governor | 1,822,257 | 1 | 2 | 3 | 28,003 | 1.54% | 47.62% | 46.08% | 3.76% | 2.54% | 867,743 | 839,740 | 68,467 | 46,307 | |
 | Lt. Governor | 1,781,333 | 1 | 2 | 3 | 7,347 | 0.41% | 49.22% | 48.80% | 0.77% | 1.21% | 876,701 | 869,354 | 13,661 | 21,617 |
Massachusetts Results for 1936
Login
© Dave Leip's Atlas of U.S. Elections, LLC 2019 All Rights Reserved
Note: The advertisement links below may advocate political positions that this site does not endorse.
Login
© Dave Leip's Atlas of U.S. Elections, LLC 2019 All Rights Reserved
Note: The advertisement links below may advocate political positions that this site does not endorse.