1936 General Election Results Comparison - Michigan
| Map | Pie | Office | Total | D | R | I | Margin | %Margin | Dem | Rep | Ind | Oth. | Dem | Rep | Ind | Other |
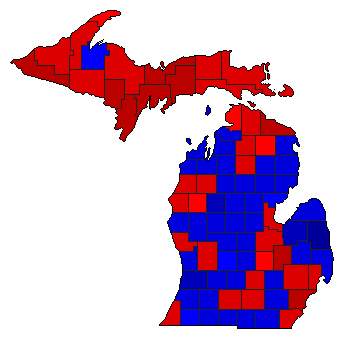
 |  | President | 1,805,098 | 1 | 2 | - | 317,061 | 17.56% | 56.33% | 38.76% | 0.00% | 4.91% | 1,016,794 | 699,733 | 0 | 88,571 |
 |  | Senator | 1,709,564 | 1 | 2 | 3 | 196,335 | 11.48% | 53.28% | 41.80% | 4.43% | 0.49% | 910,937 | 714,602 | 75,680 | 8,345 |
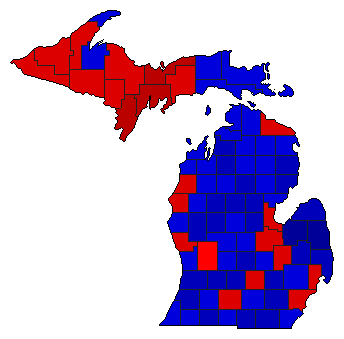 |  | Governor | 1,749,769 | 1 | 2 | 3 | 48,919 | 2.80% | 51.02% | 48.23% | 0.38% | 0.37% | 892,774 | 843,855 | 6,631 | 6,509 |
Michigan Results for 1936
Login
© Dave Leip's Atlas of U.S. Elections, LLC 2019 All Rights Reserved
Note: The advertisement links below may advocate political positions that this site does not endorse.
Login
© Dave Leip's Atlas of U.S. Elections, LLC 2019 All Rights Reserved
Note: The advertisement links below may advocate political positions that this site does not endorse.