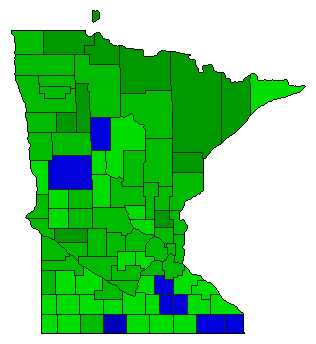
1936 General Election Results Comparison - Minnesota
| Map | Pie | Office | Total | D | R | I | Margin | %Margin | Dem | Rep | Ind | Oth. | Dem | Rep | Ind | Other |
 |  | President | 1,129,975 | 1 | 2 | - | 348,350 | 30.83% | 61.84% | 31.01% | 0.00% | 7.14% | 698,811 | 350,461 | 0 | 80,703 |
 | Senator | 1,065,767 | 0 | 2 | 1 | 260,959 | 24.49% | 0.00% | 37.76% | 62.24% | 0.00% | 0 | 402,404 | 663,363 | 0 | |
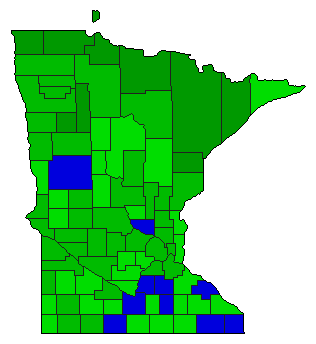 | Governor | 1,112,183 | 0 | 2 | 1 | 248,501 | 22.34% | 0.00% | 38.83% | 61.17% | 0.00% | 0 | 431,841 | 680,342 | 0 |
Minnesota Results for 1936
Login
© Dave Leip's Atlas of U.S. Elections, LLC 2019 All Rights Reserved
Note: The advertisement links below may advocate political positions that this site does not endorse.
Login
© Dave Leip's Atlas of U.S. Elections, LLC 2019 All Rights Reserved
Note: The advertisement links below may advocate political positions that this site does not endorse.