1936 General Election Results Comparison - Washington
| Map | Pie | Office | Total | D | R | I | Margin | %Margin | Dem | Rep | Ind | Oth. | Dem | Rep | Ind | Other |
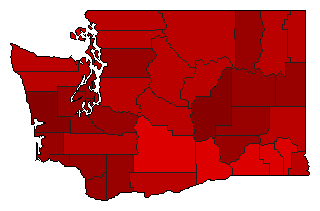
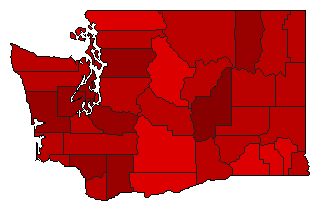
 |  | President | 692,338 | 1 | 2 | - | 252,687 | 36.50% | 66.38% | 29.88% | 0.00% | 3.74% | 459,579 | 206,892 | 0 | 25,867 |
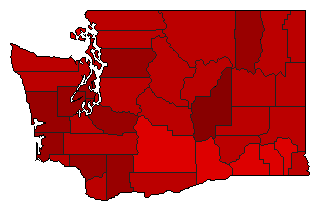
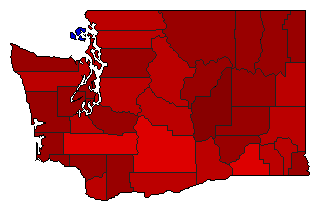
 | Governor | 672,607 | 1 | 2 | 0 | 277,409 | 41.24% | 69.36% | 28.12% | 0.00% | 2.51% | 466,550 | 189,141 | 0 | 16,916 | |
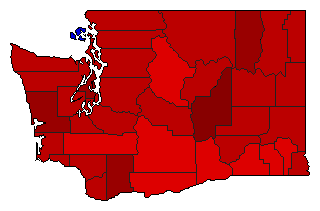
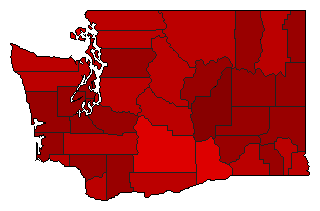
 |  | Lt. Governor | 644,797 | 1 | 2 | 0 | 239,447 | 37.14% | 67.78% | 30.65% | 0.00% | 1.57% | 437,062 | 197,615 | 0 | 10,120 |
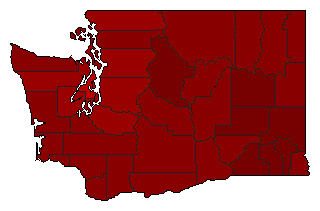
 |  | Secretary of State | 624,567 | 1 | 2 | 0 | 175,574 | 28.11% | 63.66% | 35.55% | 0.00% | 0.78% | 397,628 | 222,054 | 0 | 4,885 |
 |  | State Treasurer | 616,912 | 1 | 2 | 0 | 184,175 | 29.85% | 64.77% | 34.91% | 0.00% | 0.32% | 399,557 | 215,382 | 0 | 1,973 |
 |  | Attorney General | 605,708 | 1 | 2 | 0 | 207,227 | 34.21% | 66.94% | 32.73% | 0.00% | 0.34% | 405,450 | 198,223 | 0 | 2,035 |
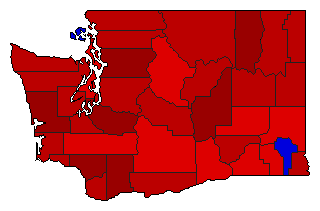
 |  | Comptroller General | 604,153 | 1 | 2 | 3 | 213,011 | 35.26% | 67.41% | 32.15% | 0.33% | 0.11% | 407,248 | 194,237 | 2,020 | 648 |
 |  | State Auditor | 615,174 | 1 | 2 | 0 | 229,183 | 37.25% | 68.46% | 31.21% | 0.00% | 0.33% | 421,157 | 191,974 | 0 | 2,043 |
 |  | Insurance Commissioner | 605,657 | 1 | 2 | 0 | 216,535 | 35.75% | 67.70% | 31.95% | 0.00% | 0.36% | 410,018 | 193,483 | 0 | 2,156 |
| Map | Pie | Initiative | Total Vote | N | Y | Margin | %Margin | No | Yes | Oth. | No | Yes | ||||
 | Initiative | 467,469 | 1 | 0 | 2 | 272,811 | 58.36% | 79.18% | 0.00% | 20.82% | 0.00% | 370,140 | 0 | 97,329 | 0 | |
Washington Results for 1936
Login
© Dave Leip's Atlas of U.S. Elections, LLC 2019 All Rights Reserved
Note: The advertisement links below may advocate political positions that this site does not endorse.
Login
© Dave Leip's Atlas of U.S. Elections, LLC 2019 All Rights Reserved
Note: The advertisement links below may advocate political positions that this site does not endorse.