1936 General Election Results Comparison - Colorado
| Map | Pie | Office | Total | D | R | I | Margin | %Margin | Dem | Rep | Ind | Oth. | Dem | Rep | Ind | Other |
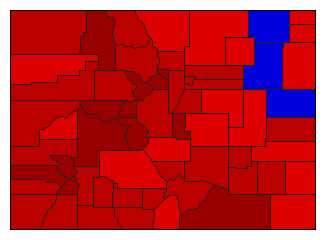
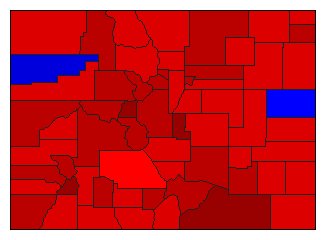
 |  | President | 488,684 | 1 | 2 | - | 113,754 | 23.28% | 60.37% | 37.09% | 0.00% | 2.54% | 295,021 | 181,267 | 0 | 12,396 |
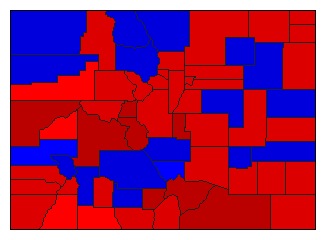
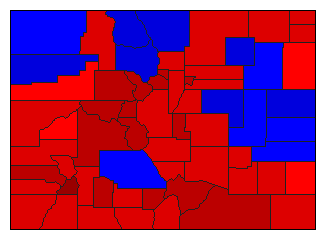
 |  | Senator | 471,827 | 1 | 2 | 3 | 133,068 | 28.20% | 63.45% | 35.25% | 0.94% | 0.36% | 299,376 | 166,308 | 4,438 | 1,705 |
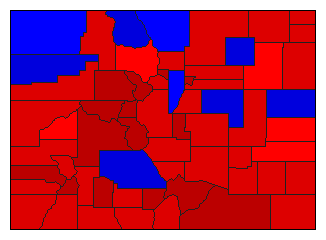
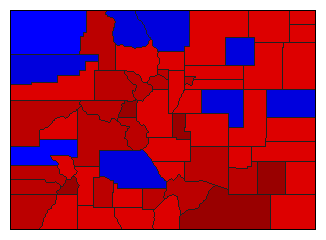
 |  | Governor | 482,535 | 1 | 2 | 3 | 52,697 | 10.92% | 54.57% | 43.65% | 1.07% | 0.71% | 263,311 | 210,614 | 5,162 | 3,448 |
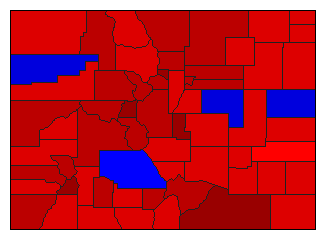
 |  | Lt. Governor | 469,269 | 1 | 2 | 3 | 79,681 | 16.98% | 56.96% | 39.98% | 1.97% | 1.09% | 267,292 | 187,611 | 9,244 | 5,122 |
 |  | Secretary of State | 467,707 | 1 | 2 | 3 | 120,505 | 25.77% | 62.47% | 36.71% | 0.58% | 0.23% | 292,190 | 171,685 | 2,733 | 1,099 |
 |  | State Treasurer | 467,087 | 1 | 2 | 3 | 118,171 | 25.30% | 61.04% | 35.74% | 2.22% | 1.00% | 285,098 | 166,927 | 10,377 | 4,685 |
 |  | Attorney General | 456,066 | 1 | 2 | 3 | 88,354 | 19.37% | 59.18% | 39.81% | 1.01% | 0.00% | 269,899 | 181,545 | 4,622 | 0 |
 |  | State Auditor | 461,948 | 1 | 2 | 3 | 79,853 | 17.29% | 56.83% | 39.55% | 2.43% | 1.20% | 262,533 | 182,680 | 11,203 | 5,532 |
Colorado Results for 1936
Login
© Dave Leip's Atlas of U.S. Elections, LLC 2019 All Rights Reserved
Note: The advertisement links below may advocate political positions that this site does not endorse.
Login
© Dave Leip's Atlas of U.S. Elections, LLC 2019 All Rights Reserved
Note: The advertisement links below may advocate political positions that this site does not endorse.