Note: The Google advertisement links below may advocate political positions that this site does not endorse.
| Map | Pie | Office | Total | D | R | I | Margin | %Margin | Dem | Rep | Ind | Oth. | Dem | Rep | Ind | Other | | | | | | | | | | | | | | | | | | |
|---|
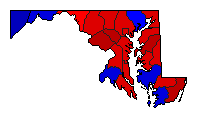
 |  | Senator |
523,238 |
1 |
2 |
4 |
203,992 |
38.99% |
68.28% |
29.29% |
0.63% |
1.80% |
357,245 |
153,253 |
3,311 |
9,429 |
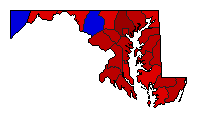
 |  | Governor |
564,540 |
1 |
2 |
3 |
66,277 |
11.74% |
54.62% |
42.88% |
1.33% |
1.16% |
308,372 |
242,095 |
7,503 |
6,570 |
 |  | Attorney General |
462,907 |
1 |
2 |
3 |
118,564 |
25.61% |
62.48% |
36.87% |
0.64% |
0.00% |
289,245 |
170,681 |
2,981 |
0 |
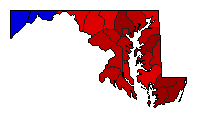 |  | Comptroller General |
463,664 |
1 |
2 |
4 |
139,078 |
30.00% |
64.11% |
34.11% |
0.33% |
1.45% |
297,246 |
158,168 |
1,536 |
6,714 |
|
