1940 General Election Results Comparison - Massachusetts
| Map | Pie | Office | Total | D | R | I | Margin | %Margin | Dem | Rep | Ind | Oth. | Dem | Rep | Ind | Other |
 |  | President | 2,026,993 | 1 | 2 | - | 136,822 | 6.75% | 53.11% | 46.36% | 0.00% | 0.53% | 1,076,522 | 939,700 | 0 | 10,771 |
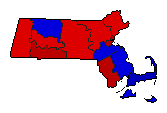 | Senator | 1,957,089 | 1 | 2 | 3 | 250,716 | 12.81% | 55.64% | 42.82% | 0.49% | 1.05% | 1,088,838 | 838,122 | 9,632 | 20,497 | |
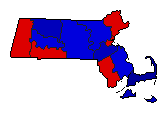 | Governor | 2,008,811 | 2 | 1 | 3 | 5,588 | 0.28% | 49.46% | 49.74% | 0.28% | 0.52% | 993,635 | 999,223 | 5,547 | 10,406 | |
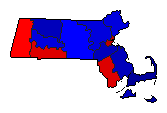 | Lt. Governor | 1,949,023 | 2 | 1 | 4 | 57,145 | 2.93% | 47.65% | 50.58% | 0.50% | 1.26% | 928,739 | 985,884 | 9,827 | 24,573 |
Massachusetts Results for 1940
Login
© Dave Leip's Atlas of U.S. Elections, LLC 2019 All Rights Reserved
Note: The advertisement links below may advocate political positions that this site does not endorse.
Login
© Dave Leip's Atlas of U.S. Elections, LLC 2019 All Rights Reserved
Note: The advertisement links below may advocate political positions that this site does not endorse.