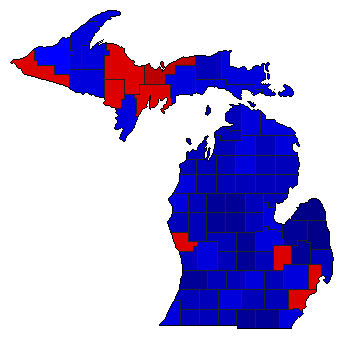
1940 General Election Results Comparison - Michigan
| Map | Pie | Office | Total | D | R | I | Margin | %Margin | Dem | Rep | Ind | Oth. | Dem | Rep | Ind | Other |
 |  | President | 2,085,929 | 2 | 1 | - | 6,926 | 0.33% | 49.52% | 49.85% | 0.00% | 0.62% | 1,032,991 | 1,039,917 | 0 | 13,021 |
 |  | Senator | 2,000,343 | 2 | 1 | 3 | 113,364 | 5.67% | 46.98% | 52.65% | 0.18% | 0.20% | 939,740 | 1,053,104 | 3,580 | 3,919 |
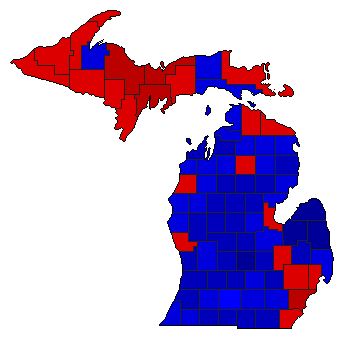 |  | Governor | 2,030,069 | 1 | 2 | 3 | 131,281 | 6.47% | 53.06% | 46.59% | 0.20% | 0.15% | 1,077,065 | 945,784 | 4,124 | 3,096 |
Michigan Results for 1940
Login
© Dave Leip's Atlas of U.S. Elections, LLC 2019 All Rights Reserved
Note: The advertisement links below may advocate political positions that this site does not endorse.
Login
© Dave Leip's Atlas of U.S. Elections, LLC 2019 All Rights Reserved
Note: The advertisement links below may advocate political positions that this site does not endorse.