1940 General Election Results Comparison - Arizona
| Map | Pie | Office | Total | D | R | I | Margin | %Margin | Dem | Rep | Ind | Oth. | Dem | Rep | Ind | Other |
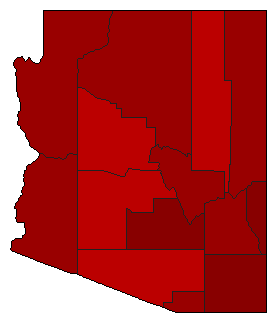
 |  | President | 150,039 | 1 | 2 | - | 41,237 | 27.48% | 63.49% | 36.01% | 0.00% | 0.49% | 95,267 | 54,030 | 0 | 742 |
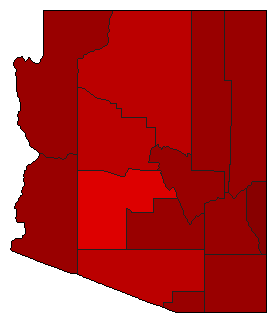
 |  | Senator | 141,731 | 1 | 2 | 3 | 61,838 | 43.63% | 71.61% | 27.98% | 0.41% | 0.00% | 101,495 | 39,657 | 579 | 0 |
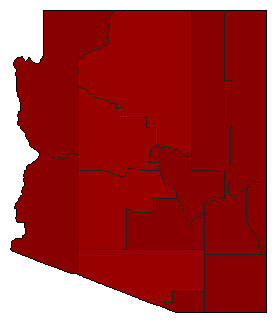
 |  | Governor | 148,967 | 1 | 2 | 3 | 47,248 | 31.72% | 65.52% | 33.80% | 0.67% | 0.00% | 97,606 | 50,358 | 1,003 | 0 |
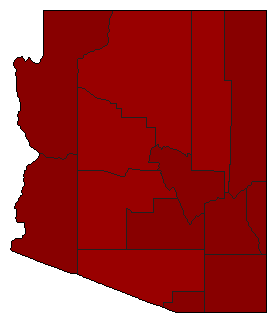
 |  | Secretary of State | 139,213 | 1 | 2 | 0 | 77,857 | 55.93% | 77.96% | 22.04% | 0.00% | 0.00% | 108,535 | 30,678 | 0 | 0 |
 |  | State Treasurer | 139,331 | 1 | 2 | 3 | 81,516 | 58.51% | 78.93% | 20.42% | 0.65% | 0.00% | 109,972 | 28,456 | 903 | 0 |
 |  | Attorney General | 141,615 | 1 | 2 | 3 | 73,380 | 51.82% | 75.61% | 23.79% | 0.60% | 0.00% | 107,072 | 33,692 | 851 | 0 |
 |  | State Auditor | 142,600 | 1 | 2 | 0 | 77,382 | 54.27% | 77.13% | 22.87% | 0.00% | 0.00% | 109,991 | 32,609 | 0 | 0 |
Arizona Results for 1940
Login
© Dave Leip's Atlas of U.S. Elections, LLC 2019 All Rights Reserved
Note: The advertisement links below may advocate political positions that this site does not endorse.
Login
© Dave Leip's Atlas of U.S. Elections, LLC 2019 All Rights Reserved
Note: The advertisement links below may advocate political positions that this site does not endorse.