1940 General Election Results Comparison - Pennsylvania
| Map | Pie | Office | Total | D | R | I | Margin | %Margin | Dem | Rep | Ind | Oth. | Dem | Rep | Ind | Other |
 |  | President | 4,078,714 | 1 | 2 | - | 281,187 | 6.89% | 53.23% | 46.33% | 0.00% | 0.44% | 2,171,035 | 1,889,848 | 0 | 17,831 |
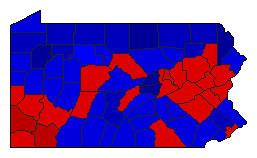 |  | Senator | 3,997,020 | 1 | 2 | 3 | 176,876 | 4.43% | 51.79% | 47.36% | 0.39% | 0.46% | 2,069,980 | 1,893,104 | 15,449 | 18,487 |
Pennsylvania Results for 1940
Login
© Dave Leip's Atlas of U.S. Elections, LLC 2019 All Rights Reserved
Note: The advertisement links below may advocate political positions that this site does not endorse.
Login
© Dave Leip's Atlas of U.S. Elections, LLC 2019 All Rights Reserved
Note: The advertisement links below may advocate political positions that this site does not endorse.