1940 General Election Results Comparison - California
| Map | Pie | Office | Total | D | R | I | Margin | %Margin | Dem | Rep | Ind | Oth. | Dem | Rep | Ind | Other |
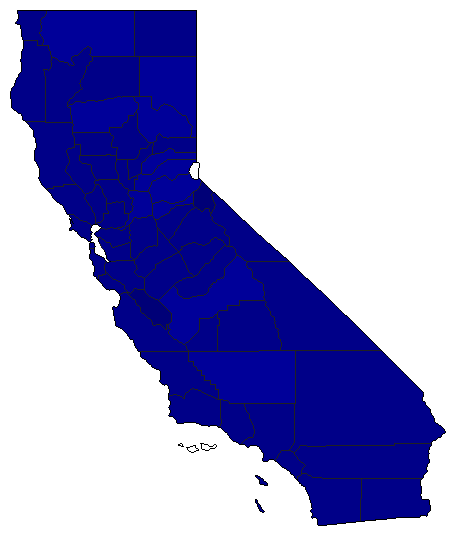
 |  | President | 3,268,791 | 1 | 2 | - | 526,199 | 16.10% | 57.44% | 41.34% | 0.00% | 1.22% | 1,877,618 | 1,351,419 | 0 | 39,754 |
 |  | Senator | 2,713,865 | 0 | 1 | 2 | 1,872,855 | 69.01% | 0.00% | 82.50% | 13.49% | 4.01% | 0 | 2,238,899 | 366,044 | 108,922 |
California Results for 1940
Login
© Dave Leip's Atlas of U.S. Elections, LLC 2019 All Rights Reserved
Note: The advertisement links below may advocate political positions that this site does not endorse.
Login
© Dave Leip's Atlas of U.S. Elections, LLC 2019 All Rights Reserved
Note: The advertisement links below may advocate political positions that this site does not endorse.