1940 General Election Results Comparison - Colorado
| Map | Pie | Office | Total | D | R | I | Margin | %Margin | Dem | Rep | Ind | Oth. | Dem | Rep | Ind | Other |
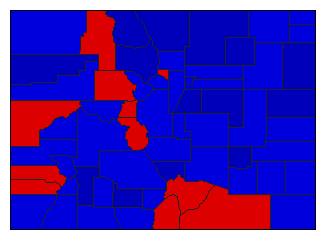
 |  | President | 549,004 | 2 | 1 | - | 14,022 | 2.55% | 48.37% | 50.92% | 0.00% | 0.71% | 265,554 | 279,576 | 0 | 3,874 |
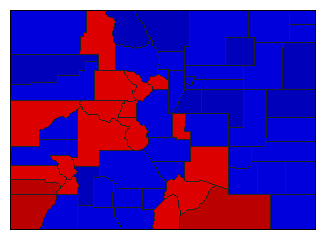
 |  | Governor | 545,636 | 2 | 1 | 3 | 51,379 | 9.42% | 44.96% | 54.37% | 0.41% | 0.27% | 245,292 | 296,671 | 2,211 | 1,462 |
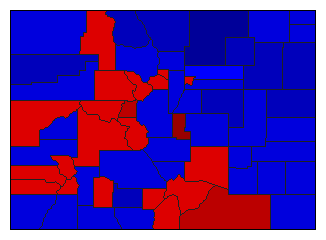
 |  | Lt. Governor | 532,140 | 2 | 1 | 3 | 29,210 | 5.49% | 46.77% | 52.26% | 0.50% | 0.47% | 248,897 | 278,107 | 2,643 | 2,493 |
 |  | Secretary of State | 533,288 | 2 | 1 | 3 | 24,307 | 4.56% | 47.48% | 52.04% | 0.48% | 0.00% | 253,211 | 277,518 | 2,559 | 0 |
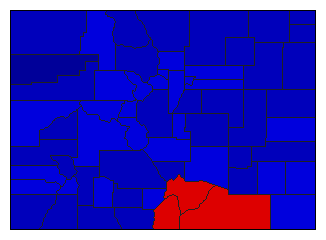
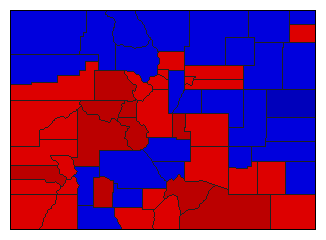 |  | State Treasurer | 538,167 | 1 | 2 | 3 | 31,846 | 5.92% | 52.36% | 46.44% | 0.76% | 0.44% | 281,786 | 249,940 | 4,090 | 2,351 |
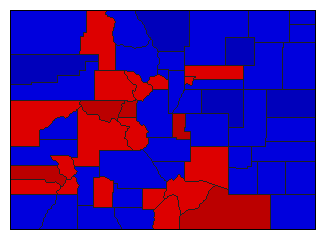 |  | Attorney General | 525,787 | 2 | 1 | 0 | 295 | 0.06% | 49.97% | 50.03% | 0.00% | 0.00% | 262,746 | 263,041 | 0 | 0 |
 |  | State Auditor | 535,096 | 2 | 1 | 3 | 91,608 | 17.12% | 41.02% | 58.14% | 0.49% | 0.35% | 219,483 | 311,091 | 2,632 | 1,890 |
Colorado Results for 1940
Login
© Dave Leip's Atlas of U.S. Elections, LLC 2019 All Rights Reserved
Note: The advertisement links below may advocate political positions that this site does not endorse.
Login
© Dave Leip's Atlas of U.S. Elections, LLC 2019 All Rights Reserved
Note: The advertisement links below may advocate political positions that this site does not endorse.