1944 General Election Results Comparison - Michigan
| Map | Pie | Office | Total | D | R | I | Margin | %Margin | Dem | Rep | Ind | Oth. | Dem | Rep | Ind | Other |
 |  | President | 2,205,223 | 1 | 2 | - | 22,476 | 1.02% | 50.19% | 49.18% | 0.00% | 0.63% | 1,106,899 | 1,084,423 | 0 | 13,901 |
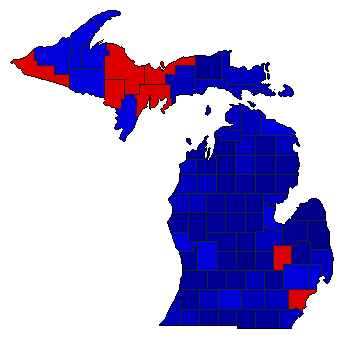 |  | Governor | 2,210,246 | 2 | 1 | 3 | 219,552 | 9.93% | 44.76% | 54.69% | 0.26% | 0.29% | 989,307 | 1,208,859 | 5,744 | 6,336 |
Michigan Results for 1944
Login
© Dave Leip's Atlas of U.S. Elections, LLC 2019 All Rights Reserved
Note: The advertisement links below may advocate political positions that this site does not endorse.
Login
© Dave Leip's Atlas of U.S. Elections, LLC 2019 All Rights Reserved
Note: The advertisement links below may advocate political positions that this site does not endorse.