1944 General Election Results Comparison - Washington
| Map | Pie | Office | Total | D | R | I | Margin | %Margin | Dem | Rep | Ind | Oth. | Dem | Rep | Ind | Other |
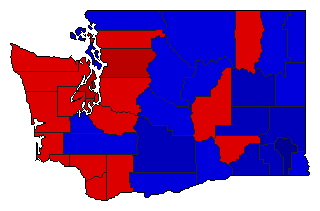
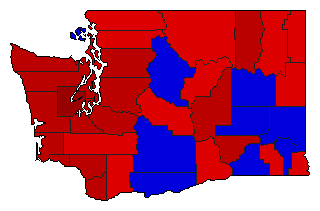
 |  | President | 856,328 | 1 | 2 | - | 125,085 | 14.61% | 56.84% | 42.24% | 0.00% | 0.92% | 486,774 | 361,689 | 0 | 7,865 |
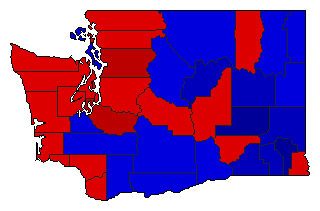
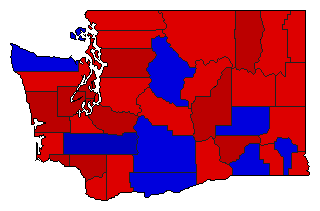
 | Senator | 819,879 | 1 | 2 | 0 | 87,657 | 10.69% | 55.13% | 44.44% | 0.00% | 0.43% | 452,013 | 364,356 | 0 | 3,510 | |
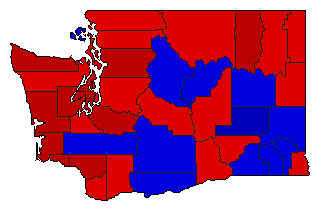
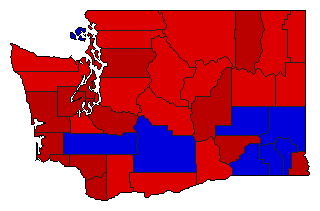
 | Governor | 832,483 | 1 | 2 | 0 | 28,230 | 3.39% | 51.51% | 48.12% | 0.00% | 0.37% | 428,834 | 400,604 | 0 | 3,045 | |
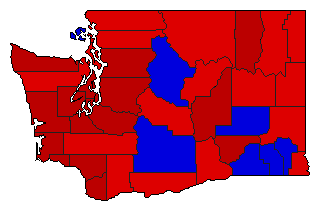
 | Lt. Governor | 804,258 | 1 | 2 | 0 | 112,220 | 13.95% | 56.86% | 42.91% | 0.00% | 0.23% | 457,300 | 345,080 | 0 | 1,878 | |
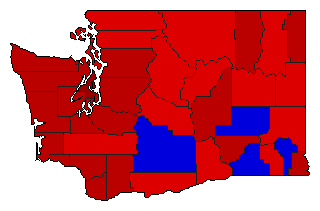 | Secretary of State | 794,406 | 1 | 2 | 0 | 173,108 | 21.79% | 60.90% | 39.10% | 0.00% | 0.00% | 483,757 | 310,649 | 0 | 0 | |
 | State Treasurer | 782,244 | 1 | 2 | 0 | 40,740 | 5.21% | 52.60% | 47.40% | 0.00% | 0.00% | 411,492 | 370,752 | 0 | 0 | |
 | Attorney General | 781,913 | 1 | 2 | 0 | 149,697 | 19.14% | 59.57% | 40.43% | 0.00% | 0.00% | 465,805 | 316,108 | 0 | 0 | |
 | Comptroller General | 783,654 | 1 | 2 | 0 | 121,654 | 15.52% | 57.76% | 42.24% | 0.00% | 0.00% | 452,654 | 331,000 | 0 | 0 | |
 | State Auditor | 784,947 | 1 | 2 | 0 | 117,980 | 15.03% | 57.41% | 42.38% | 0.00% | 0.20% | 450,663 | 332,683 | 0 | 1,601 | |
 | Insurance Commissioner | 773,514 | 1 | 2 | 0 | 150,928 | 19.51% | 59.76% | 40.24% | 0.00% | 0.00% | 462,221 | 311,293 | 0 | 0 |
Washington Results for 1944
Login
© Dave Leip's Atlas of U.S. Elections, LLC 2019 All Rights Reserved
Note: The advertisement links below may advocate political positions that this site does not endorse.
Login
© Dave Leip's Atlas of U.S. Elections, LLC 2019 All Rights Reserved
Note: The advertisement links below may advocate political positions that this site does not endorse.