1946 General Election Results Comparison - Minnesota
| Map | Pie | Office | Total | D | R | I | Margin | %Margin | Dem | Rep | Ind | Oth. | Dem | Rep | Ind | Other |
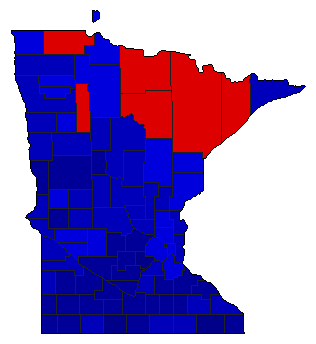
 |  | Senator | 878,731 | 2 | 1 | 3 | 168,255 | 19.15% | 39.78% | 58.92% | 1.30% | 0.00% | 349,520 | 517,775 | 11,421 | 15 |
 |  | Governor | 880,348 | 2 | 1 | 3 | 169,502 | 19.25% | 39.71% | 58.96% | 1.33% | 0.00% | 349,565 | 519,067 | 11,716 | 0 |
 |  | Lt. Governor | 856,842 | 2 | 1 | 0 | 191,376 | 22.34% | 38.83% | 61.17% | 0.00% | 0.00% | 332,733 | 524,109 | 0 | 0 |
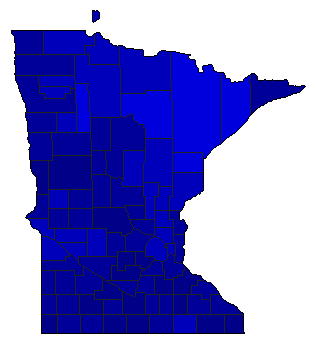 |  | Secretary of State | 877,551 | 2 | 1 | 0 | 335,285 | 38.21% | 30.90% | 69.10% | 0.00% | 0.00% | 271,133 | 606,418 | 0 | 0 |
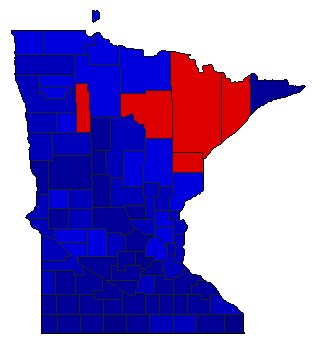 |  | State Treasurer | 859,476 | 2 | 1 | 0 | 207,664 | 24.16% | 37.92% | 62.08% | 0.00% | 0.00% | 325,906 | 533,570 | 0 | 0 |
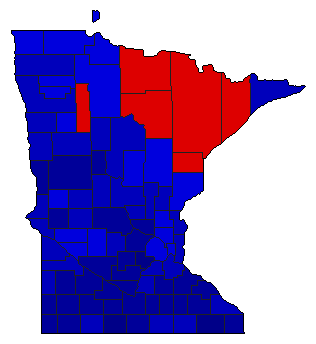 |  | Attorney General | 852,095 | 2 | 1 | 0 | 200,567 | 23.54% | 38.23% | 61.77% | 0.00% | 0.00% | 325,764 | 526,331 | 0 | 0 |
 |  | State Auditor | 854,044 | 2 | 1 | 0 | 199,508 | 23.36% | 38.32% | 61.68% | 0.00% | 0.00% | 327,268 | 526,776 | 0 | 0 |
Minnesota Results for 1946
Login
© Dave Leip's Atlas of U.S. Elections, LLC 2019 All Rights Reserved
Note: The advertisement links below may advocate political positions that this site does not endorse.
Login
© Dave Leip's Atlas of U.S. Elections, LLC 2019 All Rights Reserved
Note: The advertisement links below may advocate political positions that this site does not endorse.