| Map | Pie | Office | Total | D | R | I | Margin | %Margin | Dem | Rep | Ind | Oth. | Dem | Rep | Ind | Other | | | | | | | | | | | | | | | | | | |
|---|
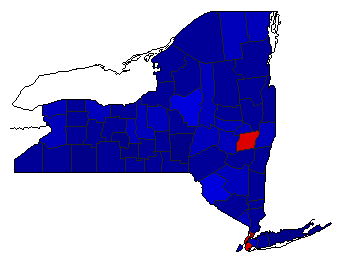
 |  | Senator |
4,867,477 |
2 |
1 |
0 |
251,253 |
5.16% |
47.42% |
52.58% |
0.00% |
0.00% |
2,308,112 |
2,559,365 |
0 |
0 |
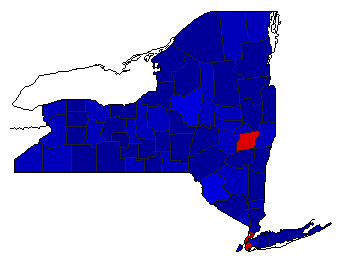 |  | Governor |
4,964,115 |
2 |
1 |
0 |
687,151 |
13.84% |
43.08% |
56.92% |
0.00% |
0.00% |
2,138,482 |
2,825,633 |
0 |
0 |
 |  | Lt. Governor |
4,801,421 |
2 |
1 |
0 |
673,391 |
14.02% |
42.99% |
57.01% |
0.00% |
0.00% |
2,064,015 |
2,737,406 |
0 |
0 |
 |  | Attorney General |
4,748,616 |
2 |
1 |
3 |
606,304 |
12.77% |
42.61% |
55.38% |
2.02% |
0.00% |
2,023,257 |
2,629,561 |
95,798 |
0 |
 |  | Comptroller General |
4,781,337 |
2 |
1 |
3 |
728,443 |
15.24% |
41.49% |
56.73% |
1.78% |
0.00% |
1,983,898 |
2,712,341 |
85,098 |
0 |
|
