1948 General Election Results Comparison - Utah
| Map | Pie | Office | Total | D | R | I | Margin | %Margin | Dem | Rep | Ind | Oth. | Dem | Rep | Ind | Other |
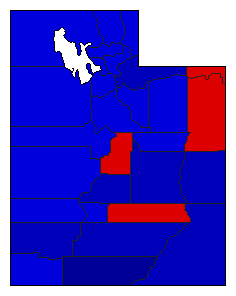
 |  | President | 276,305 | 1 | 2 | 0 | 24,749 | 8.96% | 53.98% | 45.02% | 0.00% | 1.00% | 149,151 | 124,402 | 0 | 2,752 |
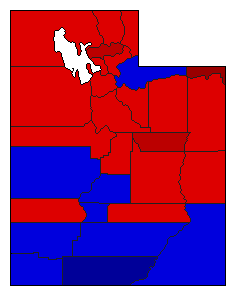
 | Governor | 275,067 | 2 | 1 | 0 | 27,439 | 9.98% | 45.01% | 54.99% | 0.00% | 0.00% | 123,814 | 151,253 | 0 | 0 | |
 | Secretary of State | 272,645 | 1 | 2 | 0 | 37,067 | 13.60% | 56.80% | 43.20% | 0.00% | 0.00% | 154,856 | 117,789 | 0 | 0 |
Utah Results for 1948
Login
© Dave Leip's Atlas of U.S. Elections, LLC 2019 All Rights Reserved
Note: The advertisement links below may advocate political positions that this site does not endorse.
Login
© Dave Leip's Atlas of U.S. Elections, LLC 2019 All Rights Reserved
Note: The advertisement links below may advocate political positions that this site does not endorse.