1948 General Election Results Comparison - Washington
| Map | Pie | Office | Total | D | R | I | Margin | %Margin | Dem | Rep | Ind | Oth. | Dem | Rep | Ind | Other |
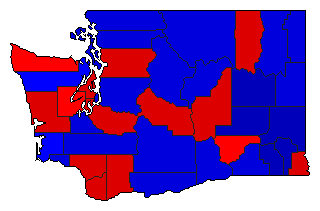
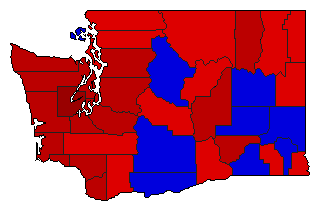
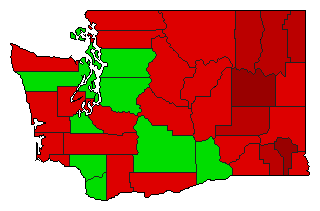
 |  | President | 905,059 | 1 | 2 | 0 | 89,850 | 9.93% | 52.61% | 42.68% | 0.00% | 4.70% | 476,165 | 386,315 | 0 | 42,579 |
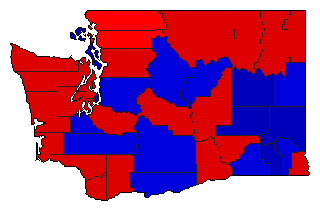
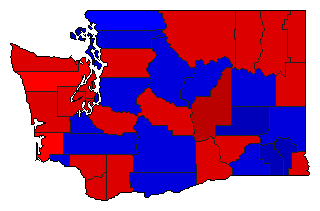
 | Governor | 883,141 | 2 | 1 | 0 | 28,923 | 3.28% | 47.22% | 50.50% | 0.00% | 2.28% | 417,035 | 445,958 | 0 | 20,148 | |
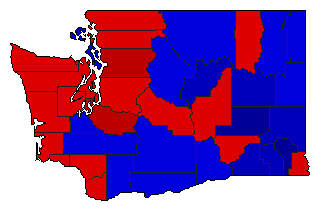
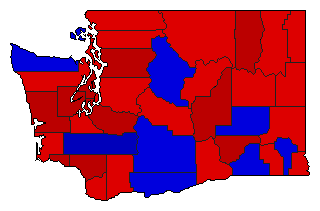
 | Lt. Governor | 841,042 | 1 | 2 | 0 | 6,450 | 0.77% | 49.24% | 48.47% | 0.00% | 2.29% | 414,127 | 407,677 | 0 | 19,238 | |
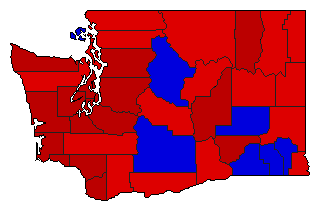
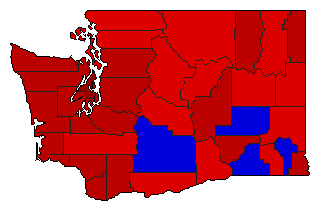 | Secretary of State | 794,406 | 1 | 2 | 0 | 173,108 | 21.79% | 60.90% | 39.10% | 0.00% | 0.00% | 483,757 | 310,649 | 0 | 0 | |
 | State Treasurer | 782,244 | 1 | 2 | 0 | 40,740 | 5.21% | 52.60% | 47.40% | 0.00% | 0.00% | 411,492 | 370,752 | 0 | 0 | |
 | Attorney General | 781,913 | 1 | 2 | 0 | 149,697 | 19.14% | 59.57% | 40.43% | 0.00% | 0.00% | 465,805 | 316,108 | 0 | 0 | |
 |  | Comptroller General | 809,701 | 1 | 2 | 3 | 1,492 | 0.18% | 48.95% | 48.76% | 2.18% | 0.11% | 396,322 | 394,830 | 17,673 | 876 |
 | State Auditor | 784,947 | 1 | 2 | 0 | 117,980 | 15.03% | 57.41% | 42.38% | 0.00% | 0.20% | 450,663 | 332,683 | 0 | 1,601 | |
 | Insurance Commissioner | 773,514 | 1 | 2 | 0 | 150,928 | 19.51% | 59.76% | 40.24% | 0.00% | 0.00% | 462,221 | 311,293 | 0 | 0 | |
| Map | Pie | Initiative | Total Vote | N | Y | Margin | %Margin | No | Yes | Oth. | No | Yes | ||||
 | Initiative | 579,512 | 2 | 0 | 1 | 3,886 | 0.67% | 49.66% | 0.00% | 50.34% | 0.00% | 287,813 | 0 | 291,699 | 0 | |
Washington Results for 1948
Login
© Dave Leip's Atlas of U.S. Elections, LLC 2019 All Rights Reserved
Note: The advertisement links below may advocate political positions that this site does not endorse.
Login
© Dave Leip's Atlas of U.S. Elections, LLC 2019 All Rights Reserved
Note: The advertisement links below may advocate political positions that this site does not endorse.