1948 General Election Results Comparison - Colorado
| Map | Pie | Office | Total | D | R | I | Margin | %Margin | Dem | Rep | Ind | Oth. | Dem | Rep | Ind | Other |
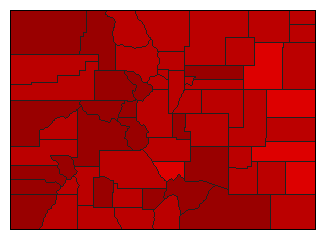
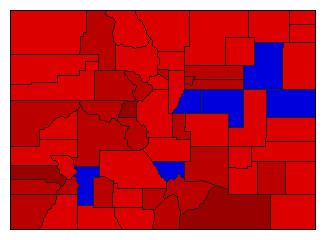
 |  | President | 515,237 | 1 | 2 | 0 | 27,574 | 5.35% | 51.88% | 46.52% | 0.00% | 1.60% | 267,288 | 239,714 | 0 | 8,235 |
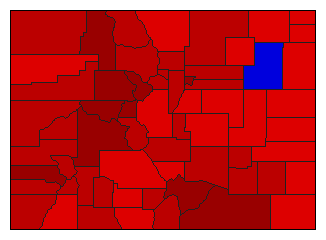
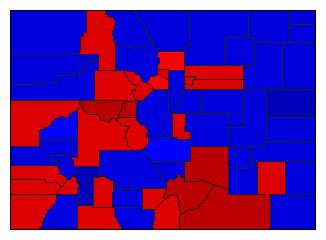
 |  | Senator | 510,121 | 1 | 2 | 3 | 175,650 | 34.43% | 66.79% | 32.36% | 0.58% | 0.27% | 340,719 | 165,069 | 2,981 | 1,352 |
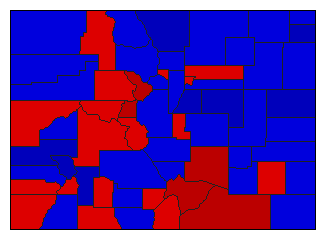
 |  | Governor | 501,680 | 1 | 2 | 0 | 163,824 | 32.66% | 66.33% | 33.67% | 0.00% | 0.00% | 332,752 | 168,928 | 0 | 0 |
 |  | Lt. Governor | 494,422 | 1 | 2 | 0 | 38,920 | 7.87% | 53.94% | 46.06% | 0.00% | 0.00% | 266,671 | 227,751 | 0 | 0 |
 |  | Secretary of State | 493,584 | 1 | 2 | 0 | 60,184 | 12.19% | 56.10% | 43.90% | 0.00% | 0.00% | 276,884 | 216,700 | 0 | 0 |
 |  | State Treasurer | 495,345 | 1 | 2 | 0 | 99,755 | 20.14% | 60.07% | 39.93% | 0.00% | 0.00% | 297,550 | 197,795 | 0 | 0 |
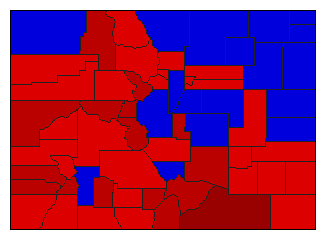
 |  | Attorney General | 490,619 | 1 | 2 | 3 | 25,209 | 5.14% | 51.99% | 46.85% | 1.16% | 0.00% | 255,063 | 229,854 | 5,702 | 0 |
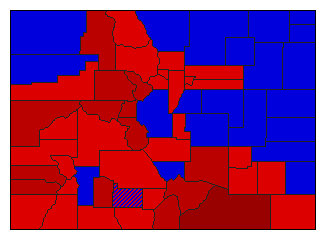
 |  | State Auditor | 488,904 | 1 | 2 | 0 | 1,064 | 0.22% | 50.11% | 49.89% | 0.00% | 0.00% | 244,984 | 243,920 | 0 | 0 |
Colorado Results for 1948
Login
© Dave Leip's Atlas of U.S. Elections, LLC 2019 All Rights Reserved
Note: The advertisement links below may advocate political positions that this site does not endorse.
Login
© Dave Leip's Atlas of U.S. Elections, LLC 2019 All Rights Reserved
Note: The advertisement links below may advocate political positions that this site does not endorse.