Note: The Google advertisement links below may advocate political positions that this site does not endorse.
| Map | Pie | Office | Total | D | R | I | Margin | %Margin | Dem | Rep | Ind | Oth. | Dem | Rep | Ind | Other | | | | | | | | | | | | | | | | | | |
|---|
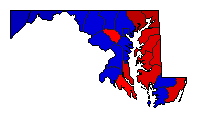 |  | Senator |
615,614 |
2 |
1 |
3 |
43,111 |
7.00% |
46.00% |
53.00% |
1.00% |
0.00% |
283,180 |
326,291 |
6,143 |
0 |
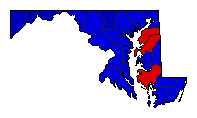 | | Governor |
645,631 |
2 |
1 |
0 |
93,983 |
14.56% |
42.72% |
57.28% |
0.00% |
0.00% |
275,824 |
369,807 |
0 |
0 |
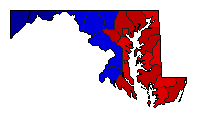 |  | Attorney General |
551,877 |
1 |
2 |
0 |
45,717 |
8.28% |
54.14% |
45.86% |
0.00% |
0.00% |
298,797 |
253,080 |
0 |
0 |
 |  | Comptroller General |
339,799 |
1 |
0 |
0 |
339,799 |
100.00% |
100.00% |
0.00% |
0.00% |
0.00% |
339,799 |
0 |
0 |
0 |
|
