| Map | Pie | Office | Total | D | R | I | Margin | %Margin | Dem | Rep | Ind | Oth. | Dem | Rep | Ind | Other | | | | | | | | | | | | | | | | | | |
|---|
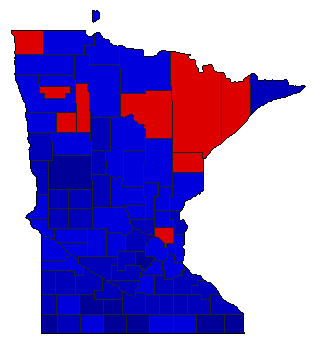
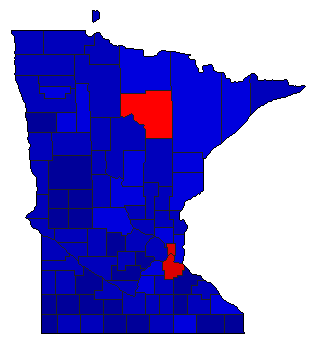 |  | Governor |
1,046,636 |
2 |
1 |
0 |
235,154 |
22.47% |
38.28% |
60.75% |
0.00% |
0.97% |
400,646 |
635,800 |
0 |
10,190 |
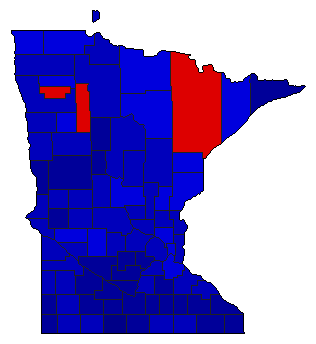
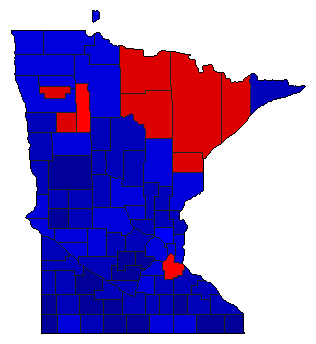 |  | Lt. Governor |
1,009,673 |
2 |
1 |
0 |
187,624 |
18.58% |
39.73% |
58.31% |
0.00% |
1.96% |
401,153 |
588,777 |
0 |
19,743 |
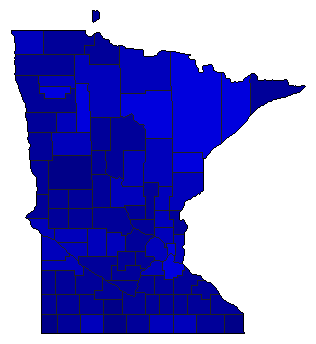 |  | Secretary of State |
1,030,558 |
2 |
1 |
0 |
342,210 |
33.21% |
33.40% |
66.60% |
0.00% |
0.00% |
344,174 |
686,384 |
0 |
0 |
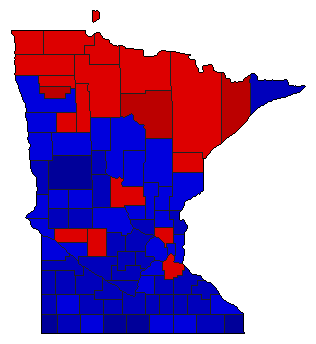 |  | State Treasurer |
986,569 |
2 |
1 |
0 |
97,473 |
9.88% |
45.06% |
54.94% |
0.00% |
0.00% |
444,548 |
542,021 |
0 |
0 |
 |  | Attorney General |
1,004,805 |
2 |
1 |
0 |
146,165 |
14.55% |
42.73% |
57.27% |
0.00% |
0.00% |
429,320 |
575,485 |
0 |
0 |
 |  | State Auditor |
999,420 |
2 |
1 |
0 |
256,090 |
25.62% |
37.19% |
62.81% |
0.00% |
0.00% |
371,665 |
627,755 |
0 |
0 |
|
